
Ross Givens
Chief Market Strategist
Ross Givens is a veteran trader with over 15 years of experience and a former VP at a major Wall Street investment bank. Specializing in small-cap stocks and momentum-driven plays, Ross identifies high-probability setups before they hit the mainstream. As Lead Strategist at Traders Agency, he has guided hundreds of successful trades and developed multiple flagship publications.

The Truth About the Blistering Small-Cap Rally
It’s Ross Givens here, with Chart of the Day. From November’s onset to yesterday’s close, the Russell 2000 surged an impressive 24.3%, marking its fourth-largest two-month gain in half a century. Amidst this rally, I see untapped potential for small-caps. With declining interest rates driving increased capital expenditures and a potential resurgence in consumer demand due to falling mortgage rates and inflation, the small-cap momentum might just be starting. But don’t expect a one-way trajectory – join me in today’s Insight to discover why I’m cautious about blindly riding the small-cap wave.

Chart Predicts Big Market Rally for 2024?
It’s Ross Givens here, with Chart of the Day. Unravel the crucial distinction between market leaders and industry leaders with me. While some 2023 market leaders align with industry dominance, others don’t. The perilous confusion between the two could be costly. Big Tech giants were both in 2023, yet maintaining their market leadership is uncertain. As 2024 approaches, I observe traders clinging to outdated leaders, unaware that small-cap stocks are poised for prominence. Join me in positioning for success with a live masterclass at 4 p.m. Eastern. Discover how historical traders thrived, ensuring your actions now set the stage for a stellar 2024. Save your seat here for a prosperous future. Clear your schedule and anticipate login details in your inbox. See you soon.
The Bull Market Marches On (Proof Inside)
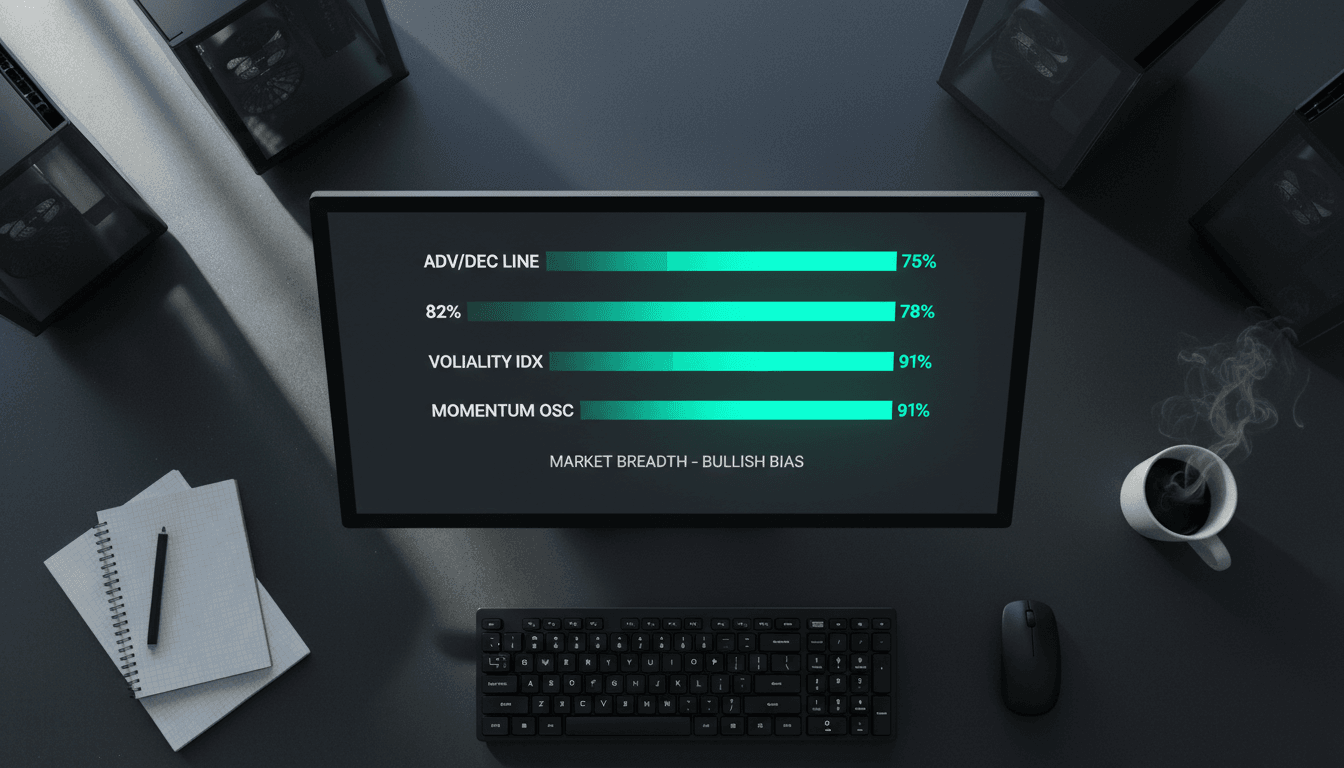
It’s Ross Givens here, with Chart of the Day. Dive into the pulse of the market with me as we decode the chart revealing over 80% of stocks soaring above their short and medium-term averages. A robust bull market scenario unfolds, with almost 65% of stocks positioned confidently above their 200-day moving average. In this exclusive sneak peek, I unveil the strategy that echoes market vitality: buy on pullbacks, not sell. Uncover the rationale behind this approach as we dissect the recent pivotal moment in the market – the sharp downturn on Wednesday. Stay ahead in the game with these insights.

The Fed “Rate Cut” Rally Has Already Begun
Hey, Ross here: I gotta hand it to Powell – he didn’t screw it up for us for traders for once. In fact, he actually managed to do the opposite. Chart of the Day The Dow is now at an all-time high. The S&P 500 is less than 2% of its all-time high and has […]

This Signals More Stock Gains Ahead
Hey, Ross here: With market sentiment quickly becoming more and more bullish, some have started to wonder whether stocks can keep going up. Where will the money come from? Today’s chart answers that question. Chart of the Day This is the total amount of assets parked in money market funds – also known as “money […]

Resistance Broken
Hey, Ross here: Welcome to a new trading week. It’s a bad time to be bearish… So let’s look at a chart that shows why that is the case. Chart of the Day The S&P 500 is on a six-week winning streak – and just broke through the 4,600 resistance mark to hit a new […]

The “Weak Hands” Opportunity
Hey, Ross here: Let’s look at a chart which shows how retail investors may be turning bearish on this rally – and why this is a good thing. Chart of the Day This is the difference in bullish vs. bearish individual investor sentiment as measured by the American Association of Individual Investor’s (AAII) Sentiment Survey. […]

Falling Yields and Surging Stocks
Hey, Ross here: If you read the financial news, it’s chock full of talking heads wondering whether this rally has “faltered” or not. So let’s look a little deeper under the hood at a big predictor of stock prices – the 10-year Treasury yield. Chart of the Day The 10-year Treasury yield has been steadily […]

Pullback Imminent?
Hey, Ross here: Let’s start the day by looking at a chart that shows why a brief market pullback could be imminent… And why this is actually a (time-sensitive) opportunity for savvy traders. Chart of the Day This is the percentage of stocks trading above their 50-day moving average – an indicator of their medium-term […]

Ready for a December Small-Cap Surge?
Hey, Ross here: For a new bull market to happen, I believe we need to see one shift happen first. The good news is – it may already be happening. Chart of the Day The small-cap Russell 2000 index has been range bound for 18 months now – completely missing out on this year’s rally. […]
Mistakes of Bull Markets Past
Hey, Ross here: Welcome to the first full trading week of December. It’s been a crazy year – so let’s take a quick look back at what’s happened so far. Chart of the Day The S&P 500 just saw its second-best November performance since 1980. The index posted a gain of 8.92% for the month. […]

Are You Prepared for a December Rally?
Hey, Ross here: It’s the first day of December, and the markets have had a fantastic month. The S&P 500 is now only 5% away from its all-time high. So let’s end the week – and start the day strong – with an actionable trade idea. Chart of the Day Crypto and digital payment companies […]
Stop watching.
Start winning.
50,000+ traders get our daily brief before the market opens.
You're subscribed!
Check your inbox.
Free. No spam. Unsubscribe anytime.
