Stock Market Blog
Daily stock market analysis, trade alerts, and trading education from Ross Givens and the Traders Agency team.

What’s Going to Happen Next
Hey, Ross here: Welcome to a brand-new trading week. As today’s chart again shows, things have been playing out just as I predicted… So read on to see what’s likely to happen next. Chart of the Day If my prediction for what’s going to happen to the markets is correct – as it has been […]

From Volatility to Opportunity
Hey, Ross here: It’s the end of the week and markets keep pulling back – just as I predicted… Especially after Powell had to go open his big mouth again to say that the Fed “was not seeing evidence that monetary policy is too tight”. There’s a bright side to all this, which I’ll share […]
Good News Amid the Final Leg Down
Hey, Ross here: One of the best ways to gauge the health of the market is by looking at the market leaders. And the undisputed market leader of 2023 – Nvidia – is showing that the final leg down for the market may soon be here. Chart of the Day This is NVDA forming what […]
Incoming Small-Cap Bounce?
Hey, Ross here: 10-year Treasury yields hit a new high yesterday. And yet, the market was largely flat. The most surprising thing? A nearly 3% gain in the beaten-down small-cap Russell 2000 Index… Which as the Chart of the Day shows, could be signaling a market bounce in the small-cap sector. Chart of the Day […]
The Market’s Wildcard
Hey, Ross here: And let’s look at some interesting price action that points to where the market could be heading in the short run. Chart of the Day The market defied the negative momentum we saw at the end of last week and rallied yesterday on the back of earnings optimism. Interestingly, yesterday’s close – […]
Just as I Predicted
Hey, Ross here: Welcome to a new trading week. With the market bouncing – then falling again – people are wondering what’s going on. Well, as today’s chart explains, things are pretty much playing out exactly as I expected. Chart of the Day This is the Nasdaq moving exactly how I predicted a couple weeks […]
Why Yesterday’s Dip = Opportunity
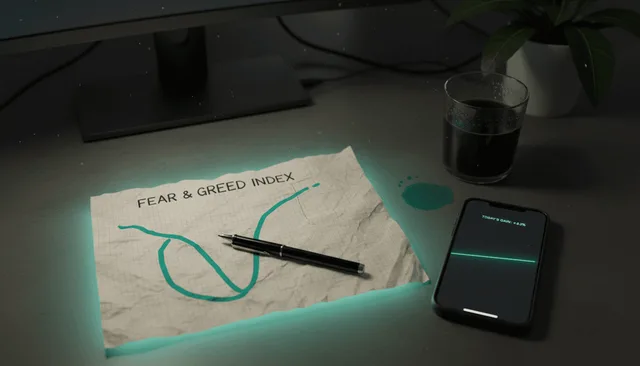
Hey, Ross here: Yes, the market bounce took a brief pause yesterday on the back of the slightly higher than expected inflation printout. But I believe the market bounce thesis still holds – and today’s chart explains why. Chart of the Day This is the Fear & Greed Index presented in chart form. And as […]
Shifting Sentiment (Get Ready)
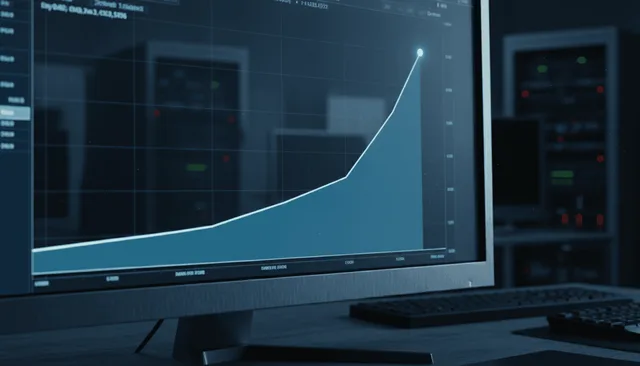
Hey, Ross here: Let’s start the day with an interesting chart that shows an uncanny resemblance between the market movements of 2021 and this year. Chart of the Day Now, this certainly isn’t as predictive as the tried-and-tested chart patterns are – and 2021 was a different time than 2023 – but it’s still interesting. […]
How to Time This Market Bounce
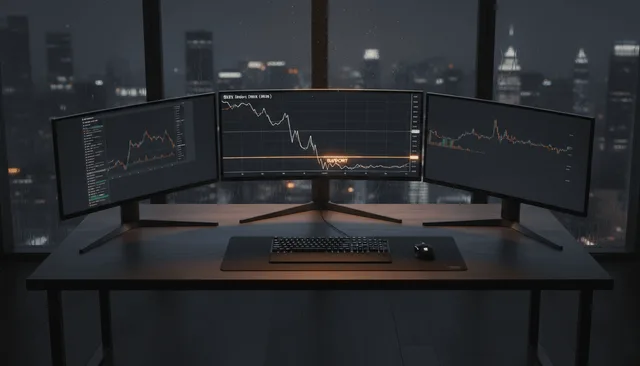
Hey, Ross here: Let’s look at another chart that continues to support my thesis that a short-term market bounce is just beginning. Chart of the Day This is the U.S. Dollar Index about to break below support. While many “gurus” out there love to bandy about the “death of the dollar” narrative, the truth is […]
More and More Evidence for the Bounce
Hey, Ross here: My short-term thesis for the market is playing out. And as the Chart of the Day shows, today’s price action could all but confirm it. Chart of the Day This is the S&P 500 displaying a classic head and shoulders chart pattern – typically a bearish pattern. The horizontal white line marks […]
Bounce or Bull?
Hey, Ross here: Welcome to a new trading week. Despite the hotter-than-expected jobs report last Friday, the market defied expectations and closed higher – even ending higher for the week. This tells me that my thesis for a short-term technical bounce is sound. But again, I don’t believe this is the resumption of the bull […]

3 Reasons for a Market Bounce
Hey, Ross here: As we end the trading week, we can see that there are three support levels that point toward a market bounce. Chart of the Day What you see here are three different lines of support for the S&P 500. The horizontal white line is the 4,200 mark – formed by both the […]
Stop watching.
Start winning.
50,000+ traders get our daily brief before the market opens.
You're subscribed!
Check your inbox.
Free. No spam. Unsubscribe anytime.
