Good Evening, Traders!
This week, I’m keeping an eye on the RTY, GC, and the 6S. With the RTY, the daily timeframe is still in an up channel and headed toward the top of the channel.
The GC is currently above the counter trendline and working its way up to the Fibonacci extension of 1922.4. That’s a potential +350 tick movement!
And the 6S has remained in an up channel as it continues its upward movement. If the 6S can stay above the bottom of the channel, I expect it to push bullish toward the top of the channel.
Let’s look at the daily timeframe charts for the RTY, GC, and 6S to get an idea of what we can expect from these markets this week:
Weekly Prep
Markets To Watch This Week:
Russell 2000 – RTY
Gold Futures – GC
Swiss Franc Futures – 6S
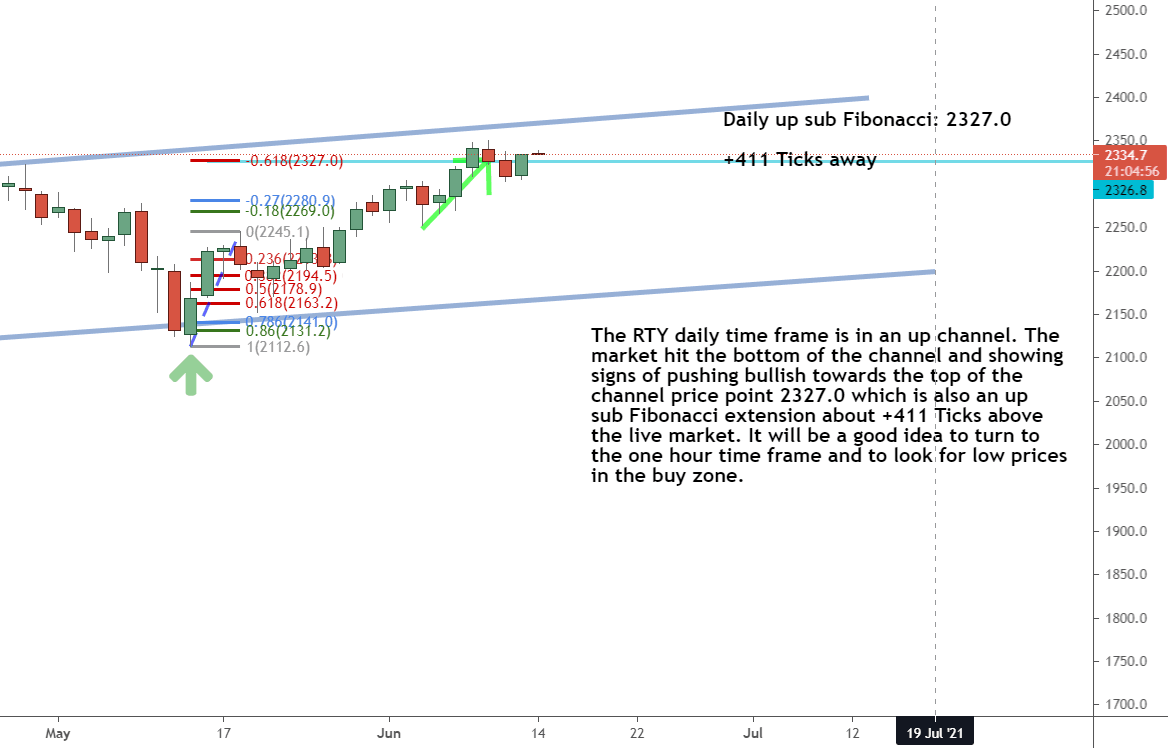
Russell 2000 – RTY
The daily timeframe for the RTY shows that the market is continuing to move to the top of the channel (upper grey line).
If the market keeps its current trend, we can expect a +411 tick movement to the Fibonacci extension of 2327.0.
Don’t forget to check out my free resources on how tick movements work to better understand the money-making potential of these trades!

Gold Futures – GC
Gold is still above the trendline (grey upper diagonal line) and remains in an overall up trend.
The market is currently +350 ticks away from the Fibonacci extension of 1922.4. We’ll want to watch the GC price movement as it gets closer to the Fibonacci extension. Once it fulfills it, we’ll watch to see if the price retraces back down to a lower price. But until that happens, we’ll follow the GC movement and watch for opportunities to enter the market within the buy zone.
I know all this talk about Fibonacci can be confusing, so take a look at my resources explaining how Fibonacci extensions work and how you can utilize them in your trading strategy.

Swiss Franc Futures – 6S
The daily timeframe for Swiss Franc futures (6S) is currently in an up channel. As the below chart shows, the market hit the bottom of the channel (lower grey line) and bounced back bullish in a positive rally.
As long as the market can remain above that bottom channel line, I expect the price to continue its upward trend. The daily Fibonacci extension is 1.125, which is just +63 ticks away. The price could retrace (temporarily drop) once it hits that point. Or we could see the price continue to rise. It’s worth watching to see what happens over the next few days.
To learn more about how I predict future market direction, read my free article on the subject so you can learn how to better predict price movements for your trades!

The Bottom Line
As you can see, each of these futures markets has its own set of variables that influence how they trade. That is why it is critical to use our timeframe charts to track trends.
Follow along as I teach you what to look for and how to approach each of these futures markets as we start a new trading week. Let’s get set to do some trading and make money!
Keep On Trading,

See more from Traders Agency on Google
Make us a preferred source and our market analysis will appear more prominently in your Google Search, Top Stories, and AI results.
Add to Preferred Sources