Trading stocks is about more than earnings reports and chart patterns. It doesn’t matter how good your setup is — you will never make money buying the wrong stocks.
Even a mediocre trader can generate phenomenal results if they’re focused on the right names.
A huge part of your success as a stock trader comes down to being in sync with market leadership. A bull market doesn’t mean every stock is going up. There are typically three to five leading groups driving the charge — the hot sectors seeing big growth, where big Wall Street investors are piling in.
If you want to win in this market, you have to find those groups. You have to locate the top stocks within them. And you have to ignore the other 5,000 stocks altogether.
This is one of the most overlooked aspects of trading. Here’s the exact blueprint for identifying the best stocks in the market, tracking sector health, and building a bulletproof watchlist.
What Drives Market Leadership
Prices are driven by big institutional investors. Hedge funds, endowments, pensions, and ETFs — these are the players buying tens of millions of shares.
When these institutions buy certain stocks in specific groups en masse, those groups go up faster than anything else.
We’ve seen this play out perfectly over the last few years. AI semiconductors were the biggest growth area in the market, and Nvidia led the pack. Last year, nuclear got hot. We were able to double and triple our money buying the leading nuclear stocks over just a couple of months.
You find these opportunities by tracking the top 40 sectors in the market. Look at their performance over the last one, two, three, and six months, and see which ones are going up the most.
It sounds overly simplistic, but it works. When you align your capital with institutional money flows, you put the wind at your back.
The Industry Strength Indicator
My industry strength indicator tracks the top 40 sectors in the market. It shows the best-performing eight sectors over each of these periods.
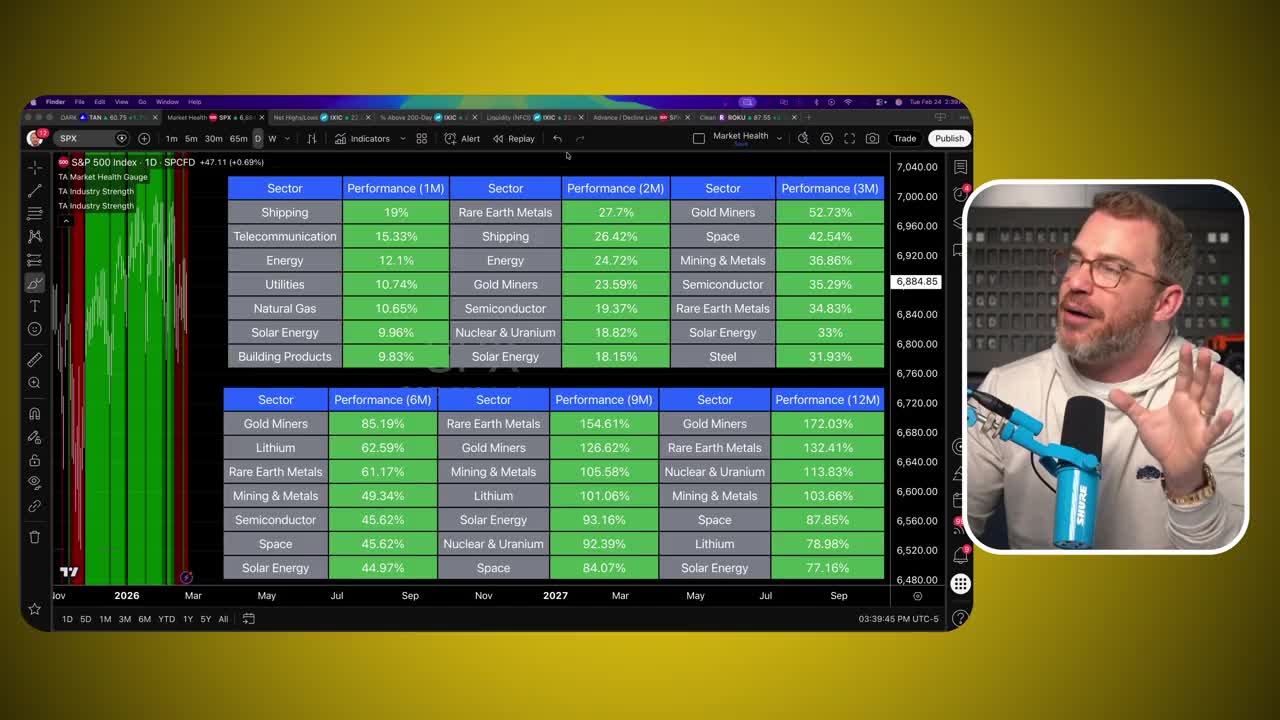
When you see a group continually showing up as a top performer over the one-month, three-month, and six-month periods, you’ve found a leading area of the market. This keeps you in sync with leadership. It shows you exactly where to focus.
The Power of ETFs
There are currently more exchange-traded funds than there are individual stocks. That’s a crazy statistic.
But it gives us a massive advantage. An ETF exists for every single group out there — from aerospace and agriculture to financials, healthcare, utilities, blockchain, and food and beverage. We can track the charts of these ETFs to gauge the health of any specific sector.
The 30-Minute Weekly Routine
Stanley Druckenmiller is one of the best investors who has ever lived. He went something like 30 years without having a down year.
He said in an interview that every single day at 4:30 p.m., he receives 270 charts. They go over every group, every currency pair, every commodity — daily, weekly, and monthly. Every single day.
You don’t need to do this every day. I certainly don’t want to. Once a week is pretty much plenty.
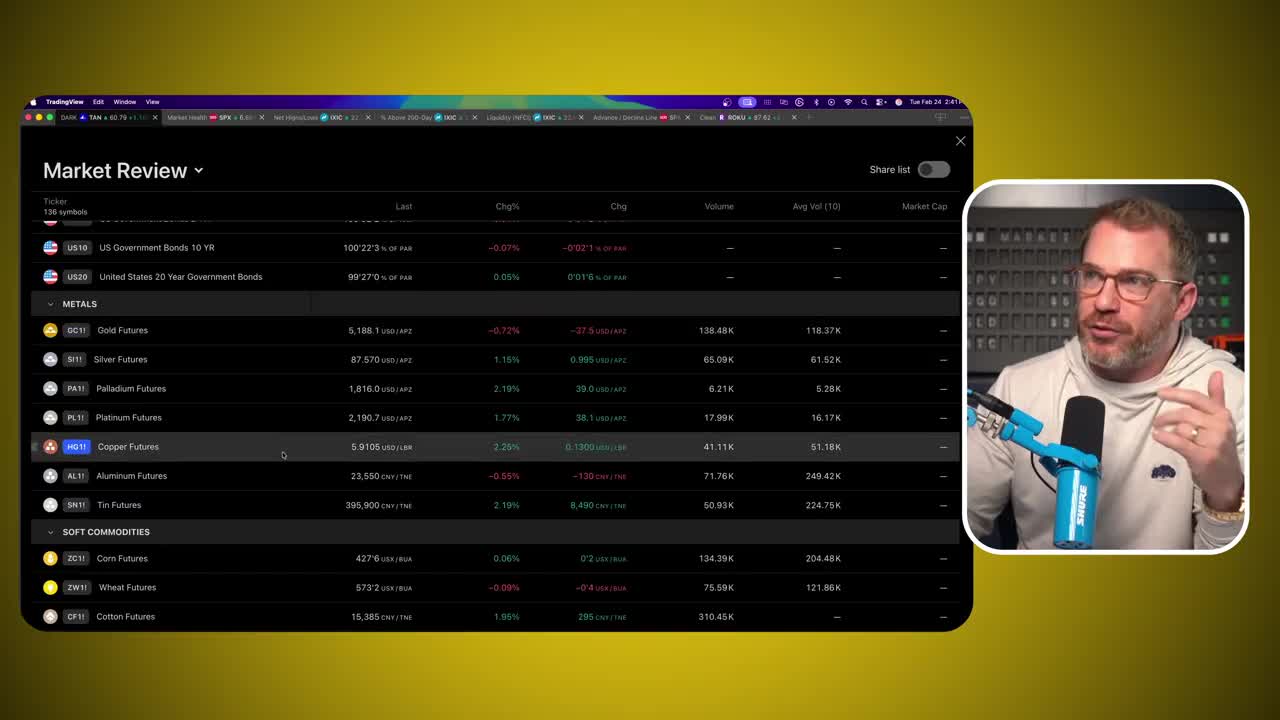
I spend about half an hour once a week running through every major market group. The major indexes, treasuries, metals markets like gold, silver, platinum, and copper. Soft commodities — everything from corn and wheat to coffee, frozen orange juice, and lean hogs. Energy, the big cryptocurrencies, and then all the industry groups.
It takes 30 minutes. It is worth every single second.
When you do this, you don’t just identify the leading areas — you also identify the groups making a resurgence. The sectors that are down big, forming a big base, and getting ready to break out. That’s how you get into the best stocks early.
Anatomy of a Perfect Setup
When reviewing these groups, I’m looking at two specific charts side-by-side: the weekly chart and the daily chart.
The Weekly Chart
On the weekly chart, I just want to see an uptrend. A multi-month trend higher. Confirmation that dollars are flowing into this sector.
The Daily Chart
The daily chart is where the actual setups live.
As stocks or sectors move higher, they don’t go straight up. They tend to stair-step their way higher — run, then consolidate, run, then consolidate. Your goal is to buy right as the price breaks out of that consolidation. That’s where the biggest opportunity lies. That’s when these stocks make the biggest and fastest runs.
The pattern has four stages:
- The Surge: A big advance higher.
- The Shallowing Consolidation: The price pulls back, but subsequent pullbacks get shorter and shallower.
- The Compression: Price compresses and forms a wedge pattern from left to right.
- The Breakout: Price breaks through resistance.
When a leading group in a good market breaks out, the individual stocks that make up that group can often move double or triple what the overall sector did.
Get my stock watchlist and an entire year of live weekly mentoring sessions, my newsletter, bonus reports, tons more. Click the link and I’ll see you in the next live session.
The Sectors Dominating Right Now
When you run this 30-minute analysis, market leadership becomes painfully obvious. Right now, there are very specific groups demanding your attention.
Rare Earth Metals (RIMIX)
Rare earths are clearly a leading area of the market. They’ve continually shown up as a top performer over the last one, three, and six months.
There was a lot of hype in rare earths over the last six months or so, and the sector got a little overcooked. That happens. But the price came down, shallowed up, tightened, and formed a nice clean breakout through resistance. Most of the stocks in this group are Chinese and foreign companies, with only a small handful of US stocks. But the strength is undeniable.
Gold Miners (GDX)
Gold miners have continually been one of the top performers over the last two, three, six, nine, and twelve-month periods.
The daily chart shows the exact pattern we want: a surge higher, followed by a nice consolidation, and then a massive breakout. The whole sector went up 35%.
I currently have a position in Hecla. That move is exactly why we find the groups breaking out first, then focus on the top stocks inside them.
Where the Next Breakouts Hide
You don’t just want to buy what has already run. You want to find the sectors setting up for their next massive leg higher.
Biotech (IBB)
Biotech has had a huge run over the last six or seven months. The weekly chart shows a big, strong multi-month uptrend. On the daily chart, it’s been consolidating for about two to three months and is beginning to break out. This is a prime hunting ground.
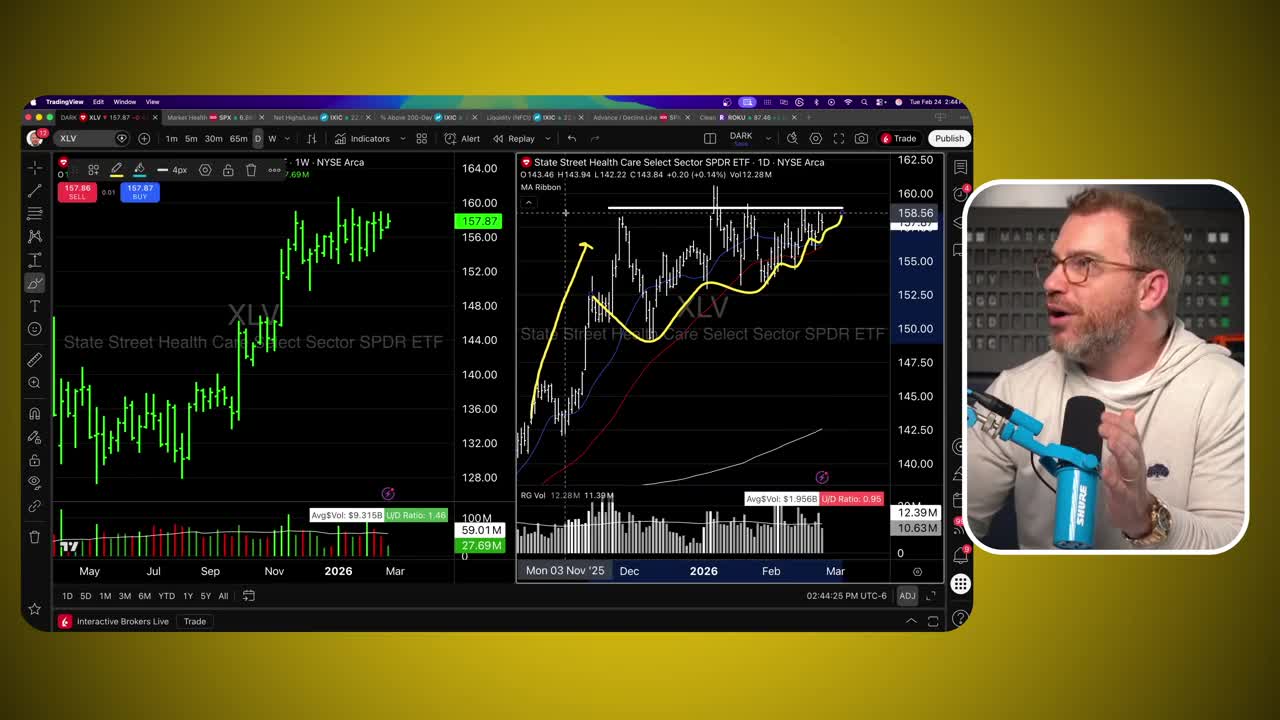
Healthcare (XLV)
Healthcare is showing the exact shallowing consolidation pattern — the surge, the compression, the setup right before a breakout. Not the most exciting sector, but the chart structure is textbook.
Clean Energy (ICLN)
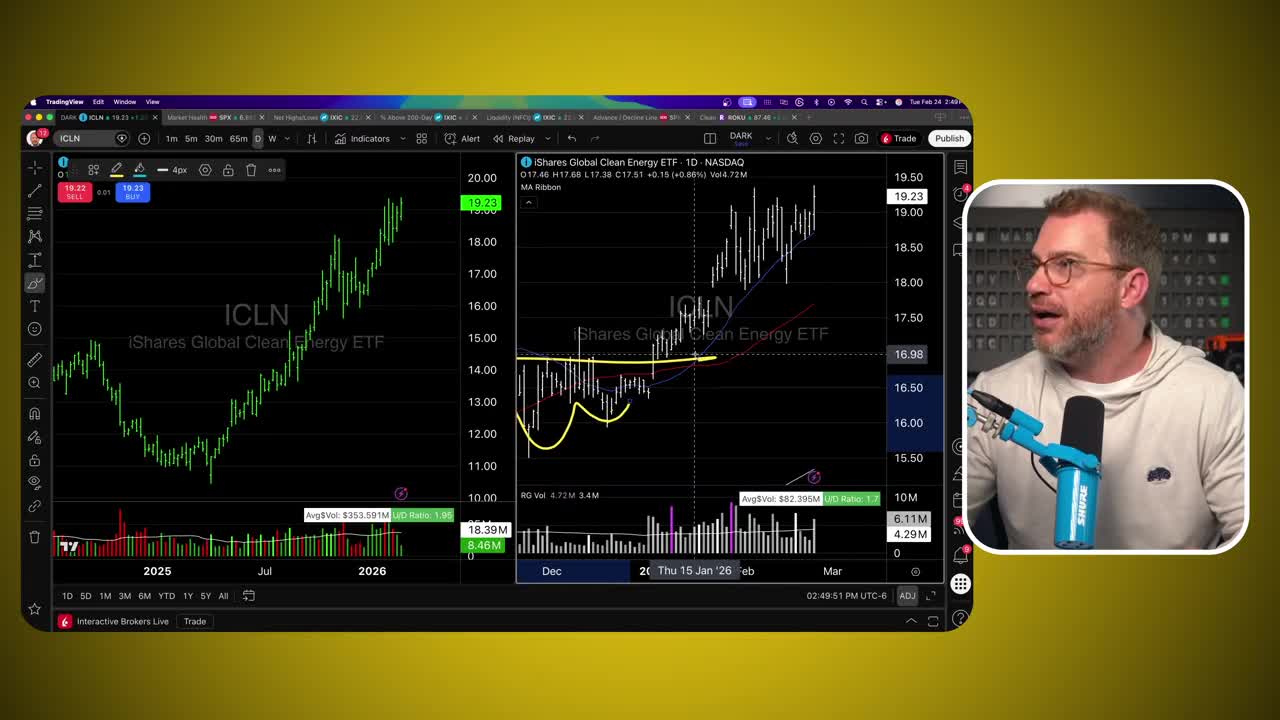
Beautiful uptrend on the weekly chart — it’s nearly doubled over the last 14 months. On the daily chart, there was a dip, a big push higher, and now another shallowing consolidation breaking out to new highs. Clean energy stocks deserve your attention right now.
What to Avoid: Financials
Financials? Absolutely not. The chart looks terrible. Am I interested in any financial stocks whatsoever? Zero. Is one of them going to do well? Probably. But 400 more are going to do terrible. Don’t try to find the needle in the haystack. Just figure out where it’s raining and put your bucket right there.
Building Your Watchlist
So we’ve got a short list of leading groups: biotech, healthcare, clean energy, rare earths, and gold miners. Here’s how you turn that into an actionable stock watchlist.
Every ETF has to share its holdings publicly. Search for any ETF’s holdings page — say, IBB for biotech — and you’ll find the top stocks by weight listed right on the website. Pull the top 10 from each leading group and add them to a single watchlist.
For biotech, that means names like GILD, VRTX, Amgen, Regeneron, ALNY, and so on. Do the same for XLV, ICLN, RIMIX, and GDX. You can even use ChatGPT to compile this faster — just ask it for the top 10 stocks by weight in each ETF.
If you find two, three, five groups in good uptrends coming out of consolidations and breaking out, and you take the top eight to ten stocks from each, you’ll have a bulletproof list of 30 to 50 stocks to fish from. It’s a stocked pond. Your only job is to not screw it up.
Spend 30 to 45 minutes on a Sunday going through the charts. Write down the top three to five groups. Pull the top eight to ten stocks from each. For the next couple of weeks, focus exclusively on that list — look for breakouts and pullbacks from those names.
I can just about guarantee your performance as a trader and investor will improve.
Get an entire year of live weekly mentoring sessions, my newsletter, indicators, bonus reports, tons more. Click the link and I’ll see you in the next live session.
DISCLAIMER: Traders Agency does not offer financial advice. The information provided is for educational purposes only and should not be considered financial advice. Traders Agency is not responsible for any financial losses or consequences resulting from the use of the information provided. Trading carries inherent risks and may not be suitable for all individuals. You are advised to conduct your own research and seek personalized advice before making any investment decisions, recognizing the potential risks and rewards involved.