


Data center stocks just got crushed, and the money quietly moved somewhere else. Over the last six months, the neocloud ETF, the fund tied to the data center group, fell 58%. While that story dominated headlines, leadership shifted into medical devices, pharmaceuticals, and biotechnology.
That shift is why I'm buying two stocks today. Neither one is a data center play.
Most traders are still scanning data center stocks looking for a bottom while the leadership has already moved into a completely different corner of the market. Here's what the charts are showing, and how I'm setting up buy triggers that adjust automatically as these stocks move.
What Are Data Center Stocks?
Bottom Line: The data center trade did not just pull back, it fell hard, while leadership quietly moved into medical devices, pharmaceuticals, and biotechnology. Rather than wait for data center stocks to bottom, the better approach is to follow where the chart evidence points right now, which currently means buying setups in that new leadership group instead.
Data center stocks are the companies tied to the data center and cloud buildout, often grouped under the "neocloud" label. They've been one of the most talked-about trades of the last year.
Talk and performance are two different things, though. The neocloud ETF, which tracks this entire group, fell 58% over the past six months. That's not a pullback. That's a collapse in a theme that was supposed to be unstoppable.
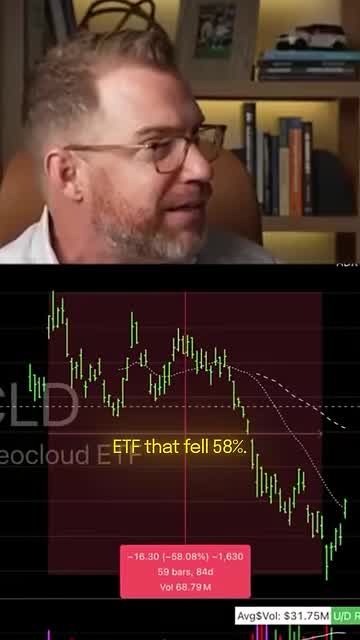
If you've been building a data center stocks list expecting it to lead the next leg higher, the last six months say otherwise.
Why Did Data Center Stocks Sell Off?
The neocloud ETF dropped 58% over six months. If you don't realize how bad that is for the group, that number tells the story on its own.
Meanwhile, the leadership shows up somewhere else entirely, in sectors that have nothing to do with data centers.
Where Did Market Leadership Actually Go?
Out of 40 different sectors and subsectors, a lot of the leadership is focused in the medical space. Medical devices. Pharmaceuticals. Biotechnology. Over and over, these categories kept showing up near the top.
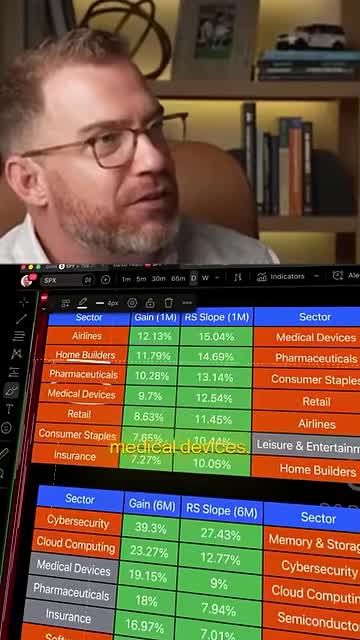
This is the part most traders miss. While the data center ETF was imploding, the leadership names had nothing to do with that theme.
That's exactly why I'm not buying a single data center stock today. I'm buying into the group that's actually leading.
Two Stocks I'm Buying Today
Pfizer: The Boring Retest Setup
Pfizer is the less exciting of the two, but the chart is clean. The stock ran up into resistance at 29, then built a shallowing base underneath that level before breaking out and starting to run.
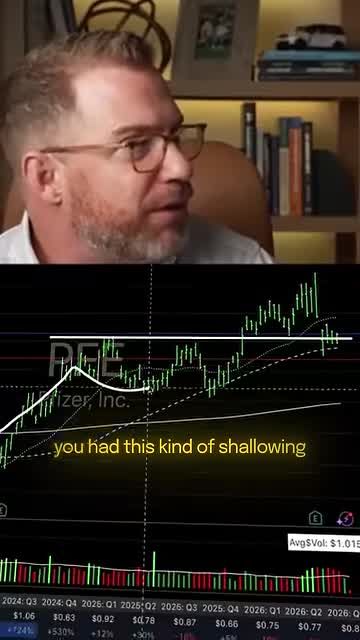
Then Thursday hit, and everything got sold off, taking Pfizer down with it. Here's the key detail: Pfizer stopped falling at the exact same level where it originally broke out. On top of that, the stock is sitting right on its 50-day moving average.
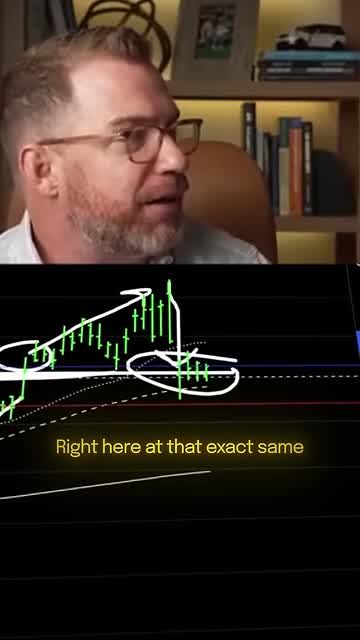
That's a retest plus a 50-day MA pullback, two things lining up at the same price during a broad selloff.
The High Tight Flag Mover
The second stock is a different animal entirely. This one is a mover, and it's setting up in a perfect high tight flag pattern.
The pattern works in three steps. First, the stock makes a big run, 50%, 80%, 100% or more, forming the flagpole. Then it carves out a shallow, controlled retracement, the flag. The buy trigger fires when price breaks back above the top side of that flag.
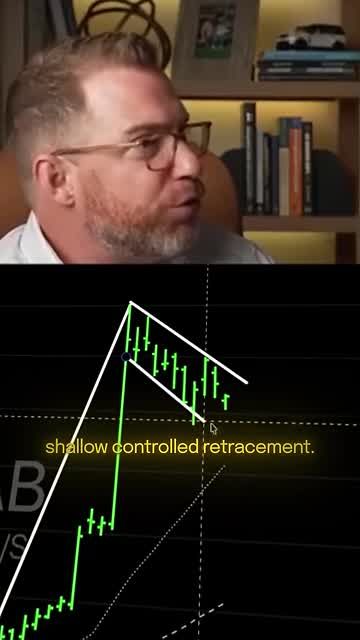
This particular stock went from 30 to 60 in a month, doubling in price. Something big massively increased this company's value, and it's now consolidating in a tight, controlled flag instead of collapsing back down.
Get an entire year of live weekly mentoring sessions, my newsletter, indicators, bonus reports, tons more. Click the link and I'll see you in the next live session.
Join my Black Ops Trading ClubHow Do You Trade a High Tight Flag?
A high tight flag is traded by buying the breakout above the top side of the flag. The pole shows the stock can move fast, and the flag is a shallow, controlled retracement.
The problem is simple: that trend line is sloped, not flat. The exact buy price is different every single day. If it breaks today, your entry is one price. If it breaks tomorrow, the line has shifted a little lower, giving you a different entry.
So how do you place a buy order against a line that's constantly adjusting?
There's a nice feature in TradingView that solves this exact problem. Draw the trend line directly on the chart, right click it, and select "add alert on trend line." Set the alert to trigger when price crosses up and above that line, and you get notified the moment it happens, no matter what day the breakout occurs.
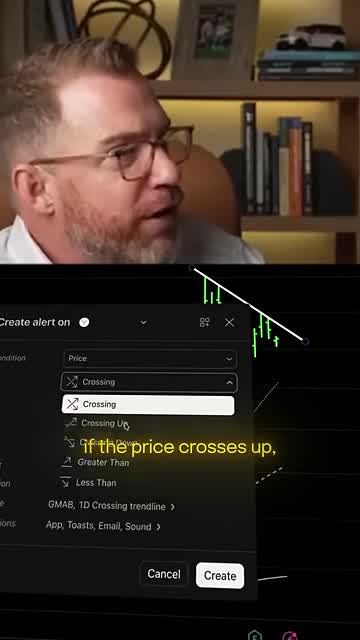
It's a small technical detail, but it's the difference between manually checking a chart every single day and letting the setup come to you.
Where the Best Buys in Data Center Stocks Are Today
Based on the current data, data center stocks are not where the best buys are right now. The neocloud ETF's 58% six-month decline speaks for itself, and a lot of the current leadership sits in medical devices, pharmaceuticals, and biotechnology instead.
That's an uncomfortable answer if you came looking for a top 10 data center stocks ranking. But the chart action and the sector data both point the same direction. The two setups I'm acting on today, the Pfizer retest and the high tight flag mover, both come from the group that's actually showing leadership: medicine, not data centers.
What Are the Best Data Center ETFs for Exposure?
The only data center ETF covered here is the neocloud ETF, and its six-month performance makes the case against chasing exposure to this group right now. A fund down 58% over six months is showing you where the weakness has concentrated.
If you're hunting for a data center ETF to add exposure, the honest takeaway is patience. Strength has to show up in the price action before it makes sense to commit capital, and right now the leadership is sitting in a completely different sector.
Data Center Stocks Under $10
Neither of the two setups covered here falls into the data center stocks under $10 category, and neither one is a data center stock at all. Pfizer broke out above a resistance level at 29, and the high tight flag mover ran from 30 to 60.
That said, the strategy applies regardless of price point. A retest at a prior breakout level combined with the 50-day moving average, or a high tight flag with a clean flagpole and controlled retracement, works the same way whether a stock trades at $5 or $500. If you're scanning a data center stocks list for lower-priced names, apply these same two patterns before committing to anything.
Follow the Leadership, Not the Headlines
Data center stocks dominated the conversation for months, and then the neocloud ETF fell 58% in six months. Out of 40 different sectors and subsectors, a lot of the leadership is now focused in the medical space: medical devices, pharmaceuticals, and biotechnology.
The two stocks I'm buying today reflect that directly. Pfizer gave me a retest at its breakout level with the stock sitting right on the 50-day moving average. The second stock set up in a high tight flag after doubling from 30 to 60 in a month.
This isn't about data centers or medicine specifically. It's about following where the chart evidence actually points, instead of staying loyal to whatever theme dominated the last six months. Set your alerts on the trend lines that matter, and let the breakout come to you.
Get an entire year of live weekly mentoring sessions, my newsletter, indicators, bonus reports, tons more. Click the link and I'll see you in the next live session.
DISCLAIMER: Traders Agency does not offer financial advice. The information provided is for educational purposes only and should not be considered financial advice. Traders Agency is not responsible for any financial losses or consequences resulting from the use of the information provided. Trading carries inherent risks and may not be suitable for all individuals. You are advised to conduct your own research and seek personalized advice before making any investment decisions, recognizing the potential risks and rewards involved.
See more from Traders Agency on Google
Make us a preferred source and our market analysis will appear more prominently in your Google Search, Top Stories, and AI results.
Add to Preferred Sources