
Hey, Ross here:
I’m widening my search beyond tech.
A handful of giant stocks are doing too much of the heavy lifting. I don’t like that.
But buyers are starting to show up outside technology, too.
Take a look.
Chart of the Day
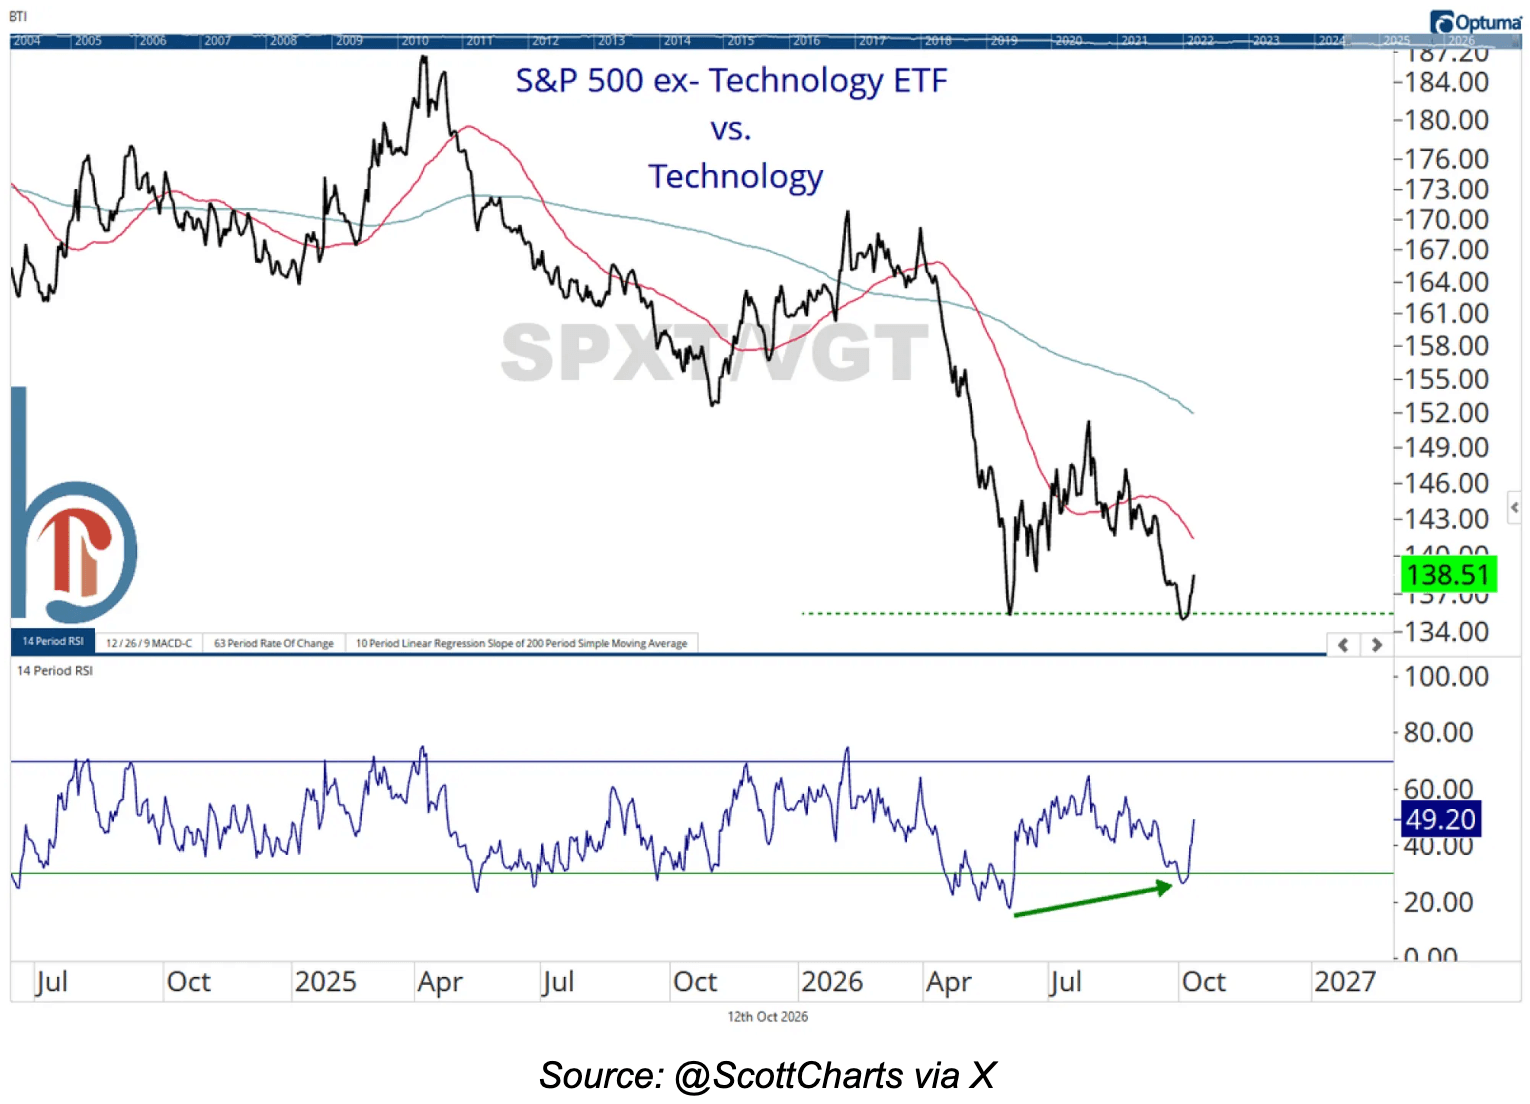
This compares the S&P 500 excluding technology with a technology stock fund.
When the line falls, tech is outperforming. When it rises, the rest of the index is doing better.
For most of this chart, tech has had the upper hand.
But look at the far right. The ratio briefly slipped below its earlier lows, then climbed back above them.
Look at the indicator below it, too. The ratio made a lower low, but momentum didn’t.
That’s an early sign that tech’s advantage may be weakening.
Here’s what that looks like in dollars and cents.
In September, the tech fund gained a little over 4%, while the fund excluding tech lost nearly 4%.
Through October 12, the fund excluding tech was up more than 3% for the month. Tech was roughly flat.
That’s a pretty big reversal in just a few weeks.
Now, look at how far that ratio has fallen.
One bounce doesn’t undo all of that. I want to see it hold these gains.
But there are stocks outside tech I want to look at now.
And waiting for the whole market to recover could mean missing them.
Insight of the Day
Your next trade doesn’t need the whole market’s approval.
When the market looks shaky, it’s easy to stop looking for trades.
You figure you’ll get back to it when things settle down.
But some stocks will have already taken off by then.
A company that lands a big contract can attract buyers even when the indexes are struggling. So can a business that’s finally starting to turn around.
That’s why I still look at individual stocks in a market like this.
I want to see which ones hold their ground on bad days and whether buyers keep coming back.
I’ll be careful about how much money I put into a trade.
I’m not going to stop looking just because I’m cautious about the market.
But finding a stock that’s holding up is just the start.
I want to know what could send it much higher from here.
Sometimes, before a big announcement hits the headlines, somebody has already placed a substantial bet on that stock.
When that bet is far larger than the stock’s usual trading activity would lead me to expect, I want to take a closer look.
It doesn’t guarantee a big move.
But it can give me a reason to investigate before the news comes out and everybody rushes into the same trade.
That’s why I look for unusual trading activity alongside the strength I’m already seeing in the stock.
That’s what I’m going to show you today at 3 p.m. Eastern.
I’ll reveal a little-known technique for tracking these signals – and show you the top trades it’s signaling right now.
It has identified moves as large as 806% in just six days.
And you don’t need a $25,000 or $100,000 account to start using it.
I’ll show you how the technique works and how to use it in your own trading – both to help protect your money and to go after bigger gains.
If you’ve been waiting for the entire market to look better before making your next move, come see what we’re finding in individual stocks.
Click here to lock in your free seat for today’s LIVE strategy session at 3 p.m. ET.
I’ll see you this afternoon.
P.S. If you’re planning to attend on a mobile device, make sure you download the presentation app now so you don’t miss anything when it starts. See you there.
iOS: apps.apple.com/us/app/goto/id1465614785
Android: play.google.com/store/search?q=goto&c=apps
Customer Story of the Day
"I am extremely pleased with the service I have received as normal.
I have never been disappointed ever. The way it looks no one has or ever will.
There is a good group of people here ready to help no matter the issue.
Thank you guys. Will talk again soon."
Embrace the surge,

Ross Givens
See more from Traders Agency on Google
Make us a preferred source and our market analysis will appear more prominently in your Google Search, Top Stories, and AI results.
Add to Preferred Sources