
Hey, Ross here:
Yesterday I told you I’d look outside AI for the next breakout.
So today…
Let’s take a look at what happened the last time a tech bubble actually burst.
Chart of the Day
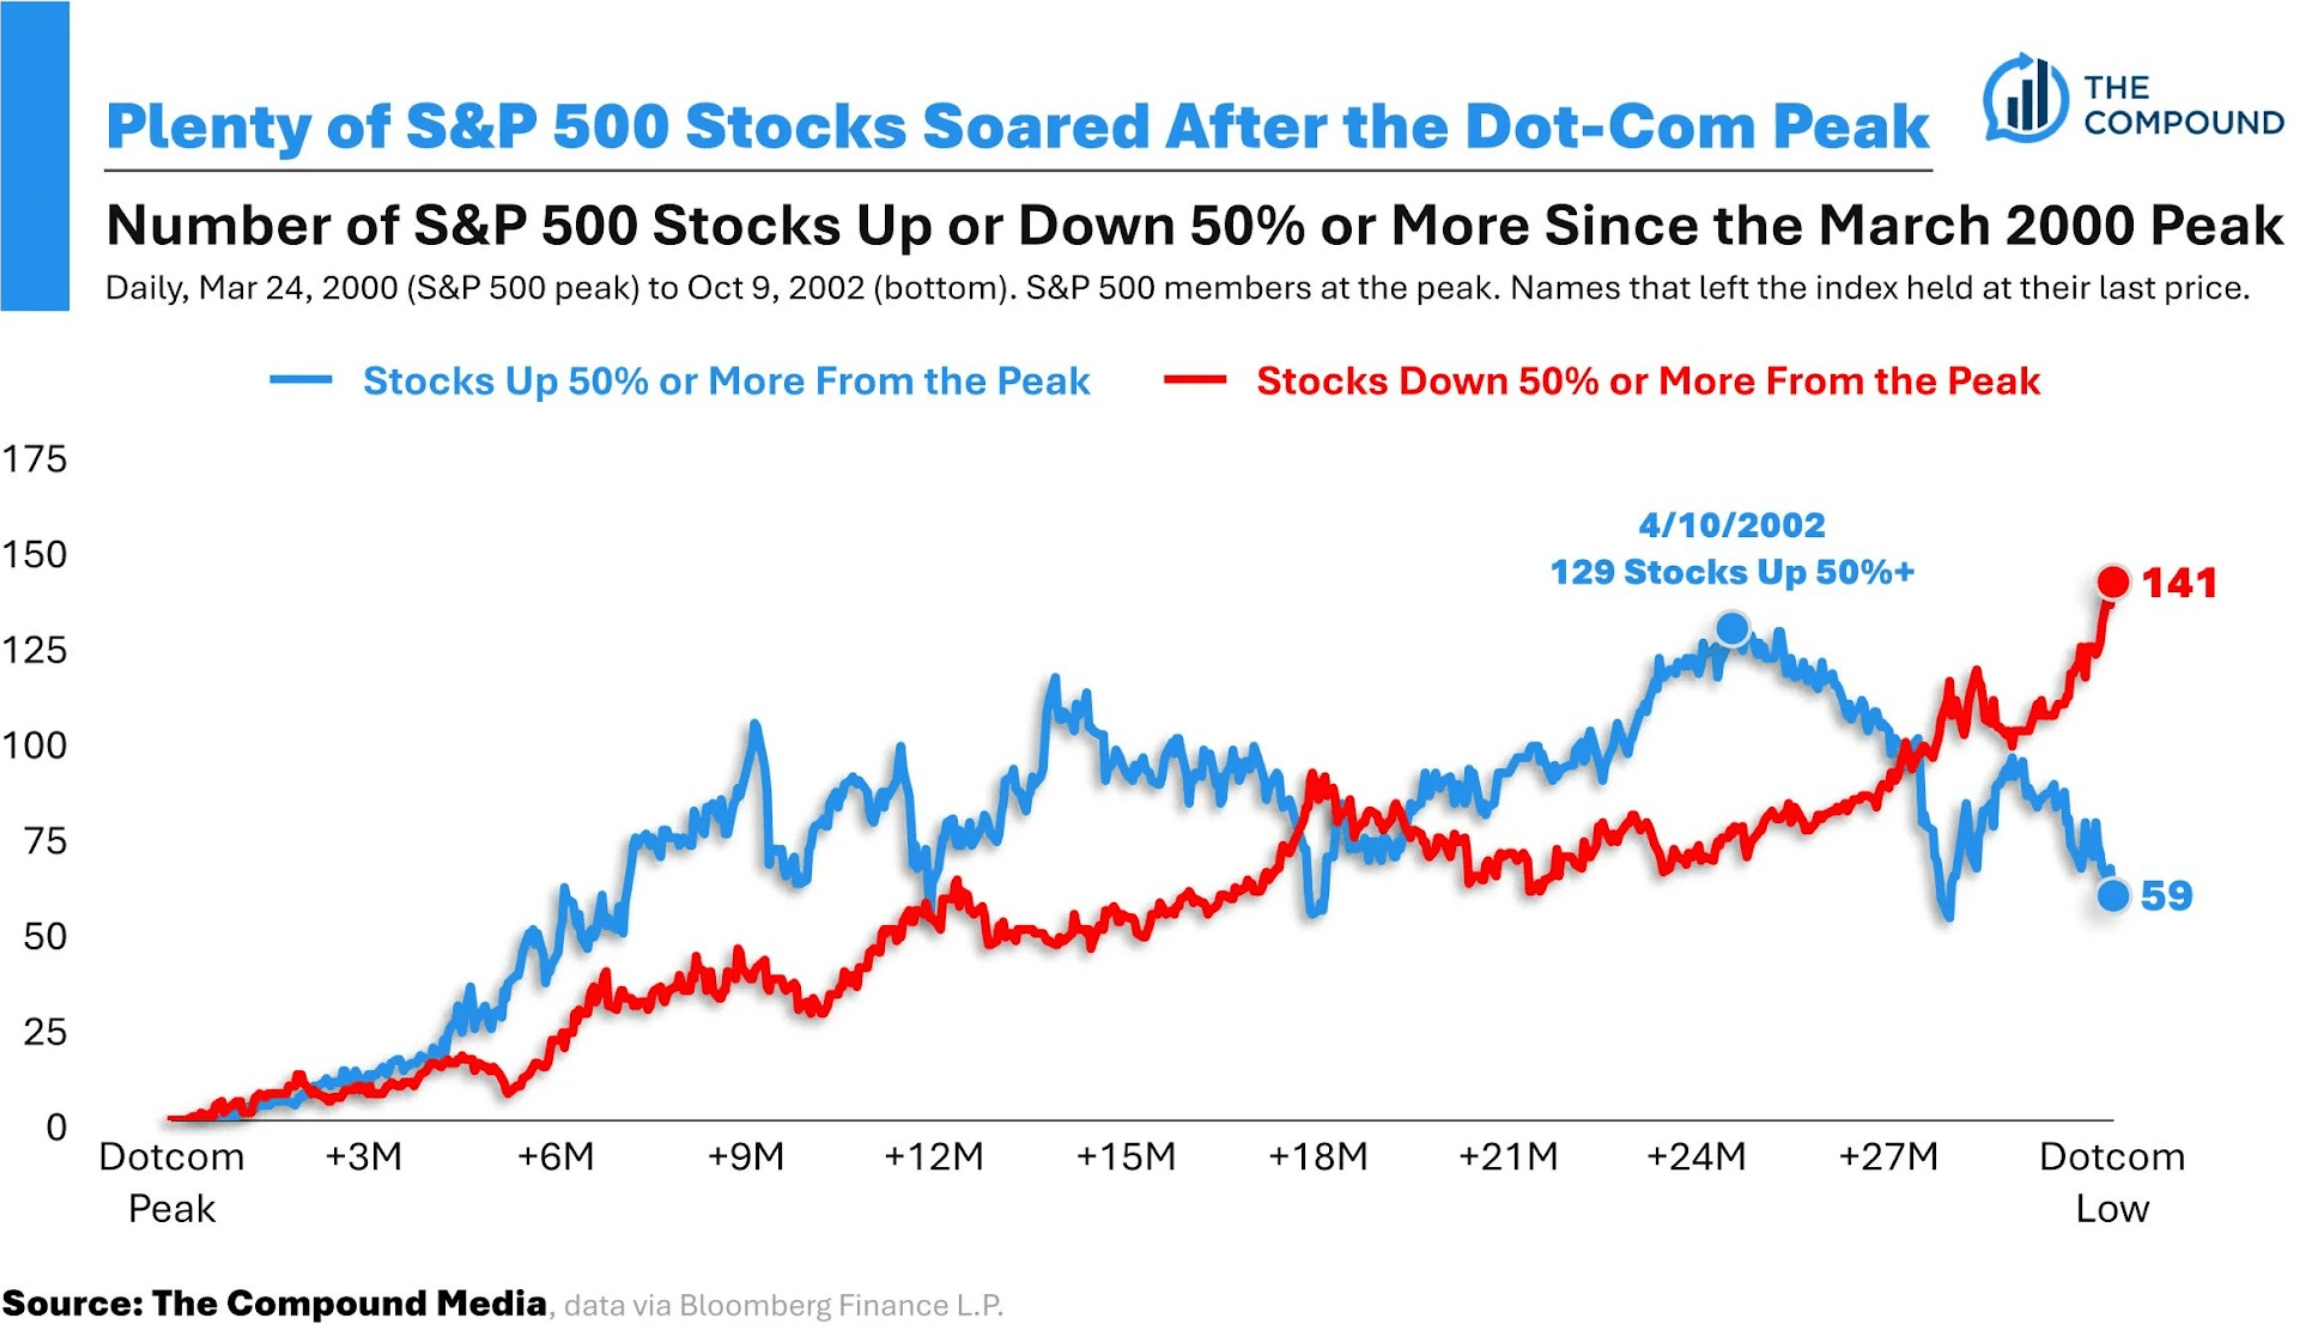
Take every stock in the S&P 500 and start the clock at the dot-com peak.
Two years later, which group do you figure was bigger – the stocks up 50% or the stocks down 50%?
You’d figure more stocks got cut in half.
Turns out more of them gained 50%.
If all you remember is what happened to tech, that sounds crazy.
Now look at where those winners came from.
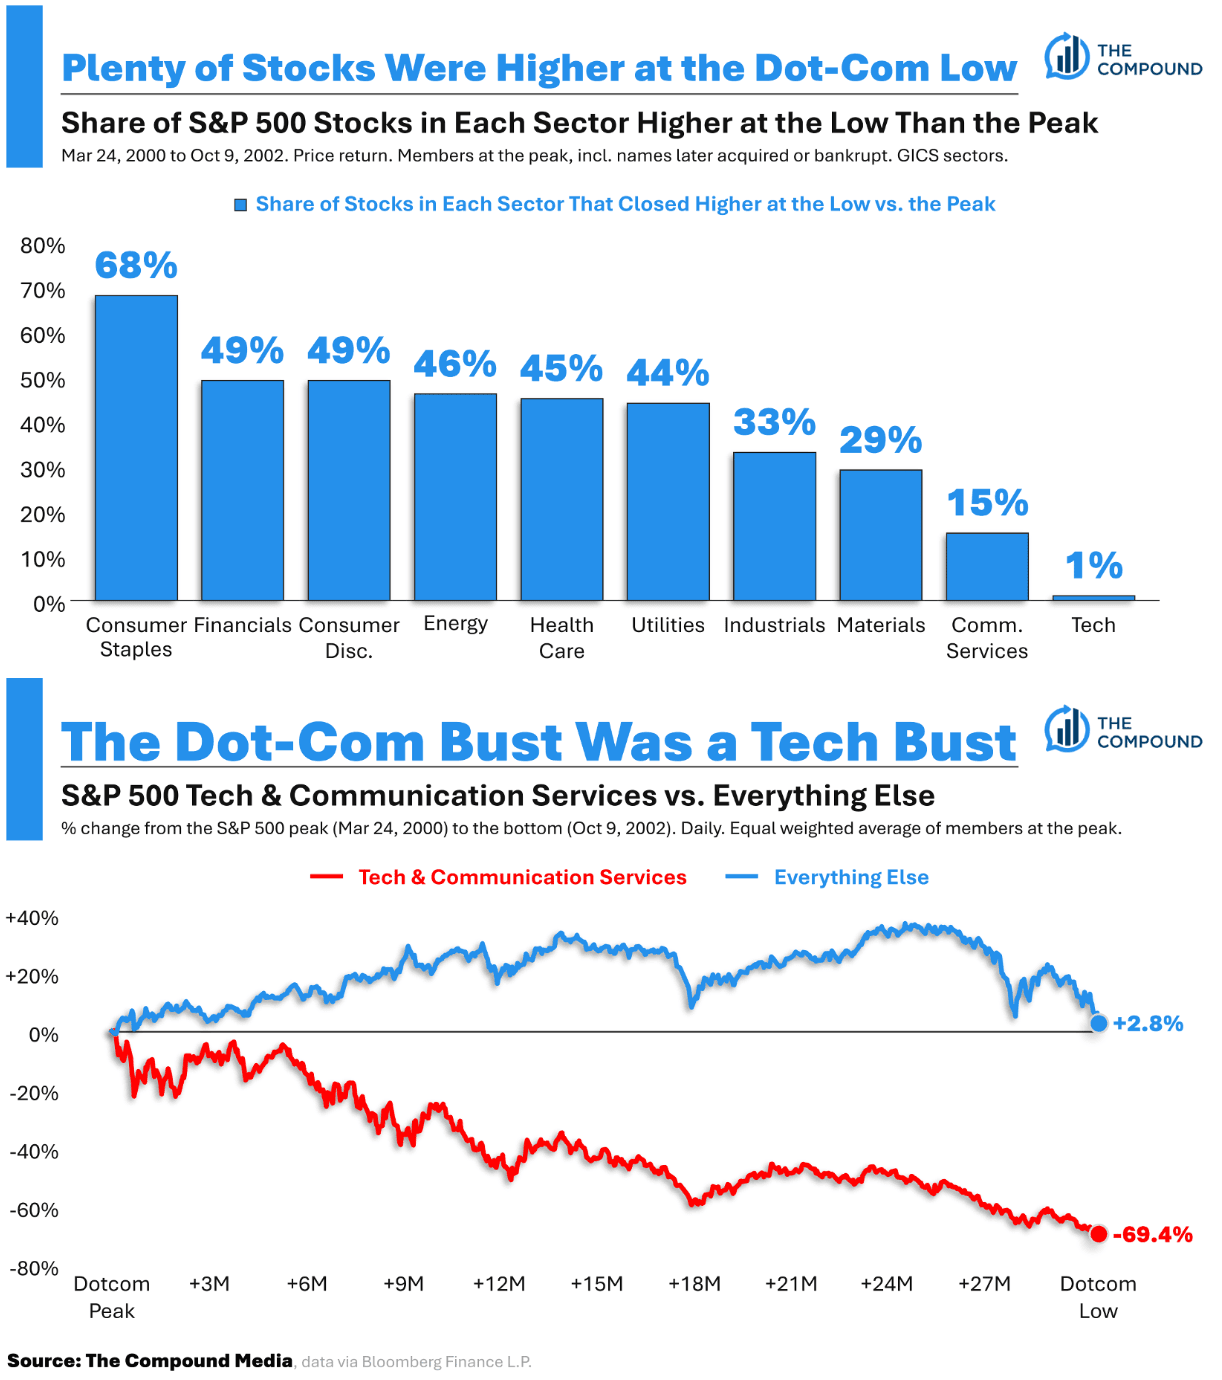
Each bar tells you what share of the stocks in that sector went UP during the crash.
The average tech and communication services stock lost 69.4%.
But take those two groups out and the average stock in the rest of the index actually gained 2.8%.
That little 2.8% average hid some mighty big winners.
And that was with tech in a full-blown crash.
In other words, even if the AI trade completely crashes…
History tells us there are always opportunities elsewhere.
Of course, I’m not saying that AI trade is about to crash.
In fact, it looks like it could have just hit a near-term bottom.
Look at the chart below.
The SOX tracks semiconductor stocks. It fell more than 20% in six trading days.
Then it jumped more than 15% in just four.
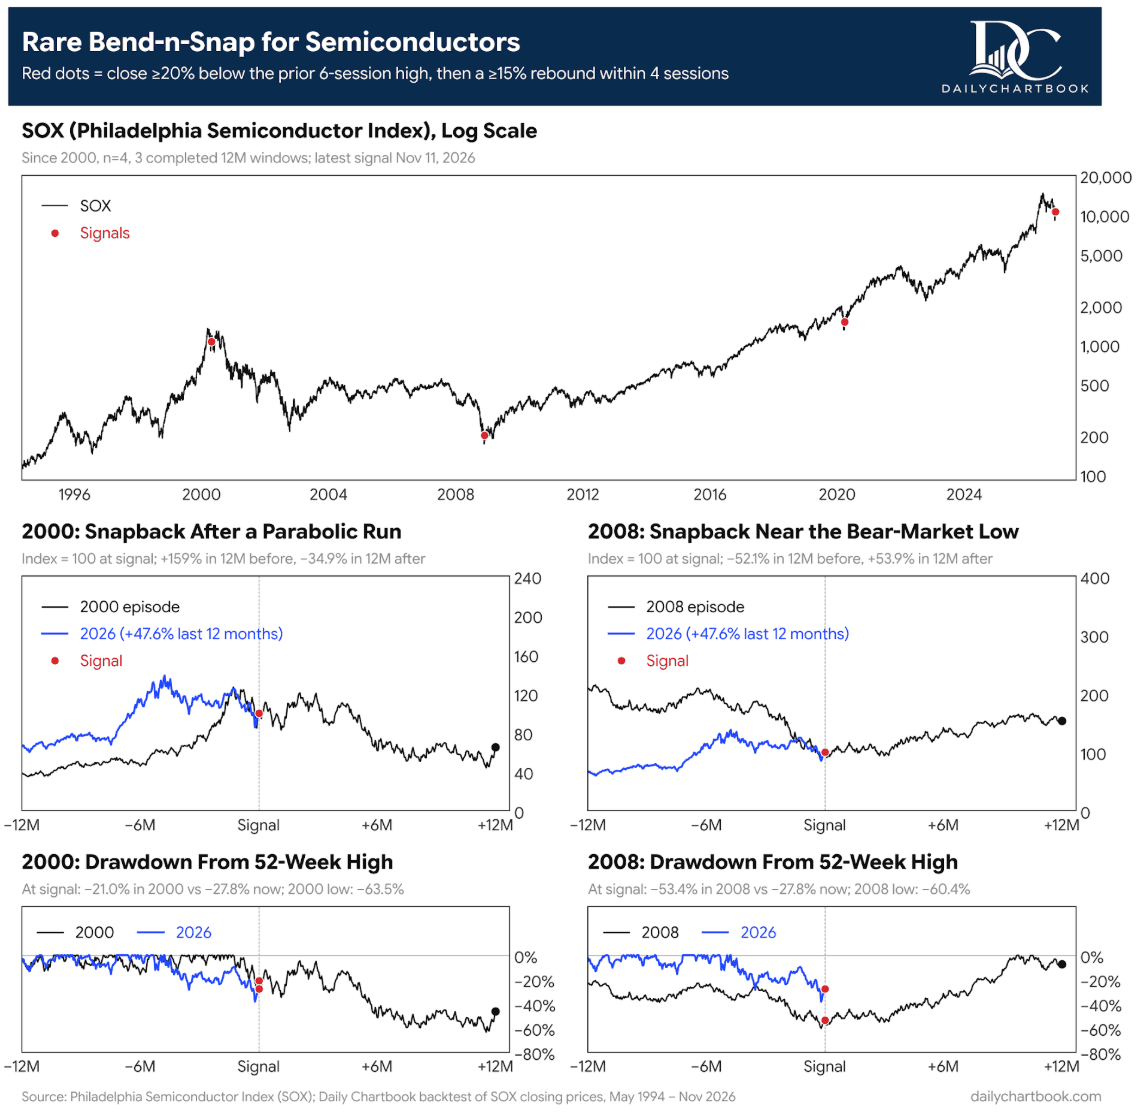
That’s a major reversal.
And two of the three previous reversals this big came near major lows – in 2008 and 2020.
The other one? Right near the dot-com top.
So I wouldn’t bet the farm on which one we’re getting this time.
But after seeing those first two charts, why would you need to?
Insight of the Day
You can find the next winner without calling the top in the last one.
Say you got the biggest call of 2000 dead right. You sold your tech stocks at the top.
But what did that tell you about what to buy over the next two years?
Look how much money you could have left on the table by deciding the whole market was shot.
This is what gets lost in all the arguing over whether AI is a bubble.
A fund manager who sells chip stocks still has a portfolio to run.
If he likes what he sees in another industry, he can put that money to work tomorrow morning.
He doesn’t need the Nasdaq to get back to its highs first.
Neither do you.
Maybe the AI bulls get their rally.
Maybe the bears get to say they called the top.
I’m happy to let them fight that one out…
Because while they’re doing so, I’m hunting for the stocks the biggest buyers – the ones that actually move the market – are already bidding up elsewhere.
And tomorrow, Friday, November 13 at 11 a.m. Eastern…
I’m going LIVE to show you how I target these stocks…
Using a “big money” pattern that’s delivered wins like…
146% on NuScale Power in 53 days…
206% on Alpine Immune Sciences in 77 days…
And 87% on Nikola in just 24 hours.
I’ll show you what I’m seeing in this market – and how you can start targeting similar gains immediately.
So click right here to claim your free seat for tomorrow’s live broadcast…
And I’ll see you Friday at 11 a.m. ET sharp.
Customer Story of the Day
“I’m not someone that usually leaves reviews, however, if I could give more stars I absolutely would!
I am currently enrolled in two of their courses. I knew NOTHING about the stock market when I joined back in March after seeing Ross on The Cartier Family YouTube Channel.
Ross and Jean have rather quickly taught me how to navigate the market. They are so patient with ‘newbies’ like me and have eagerly answered my questions with demonstrations.
I would highly recommend this down to earth and knowledgeable team to anyone that is on the fence about joining. Just take the leap and watch your wallet grow!”
Embrace the surge,
Ross Givens
See more from Traders Agency on Google
Make us a preferred source and our market analysis will appear more prominently in your Google Search, Top Stories, and AI results.
Add to Preferred Sources