
Hey, Ross here:
The S&P 500 still has some warning signs.
But look beyond the biggest names, and there’s a hidden recovery most traders are missing.
Let’s take a look.
Chart of the Day
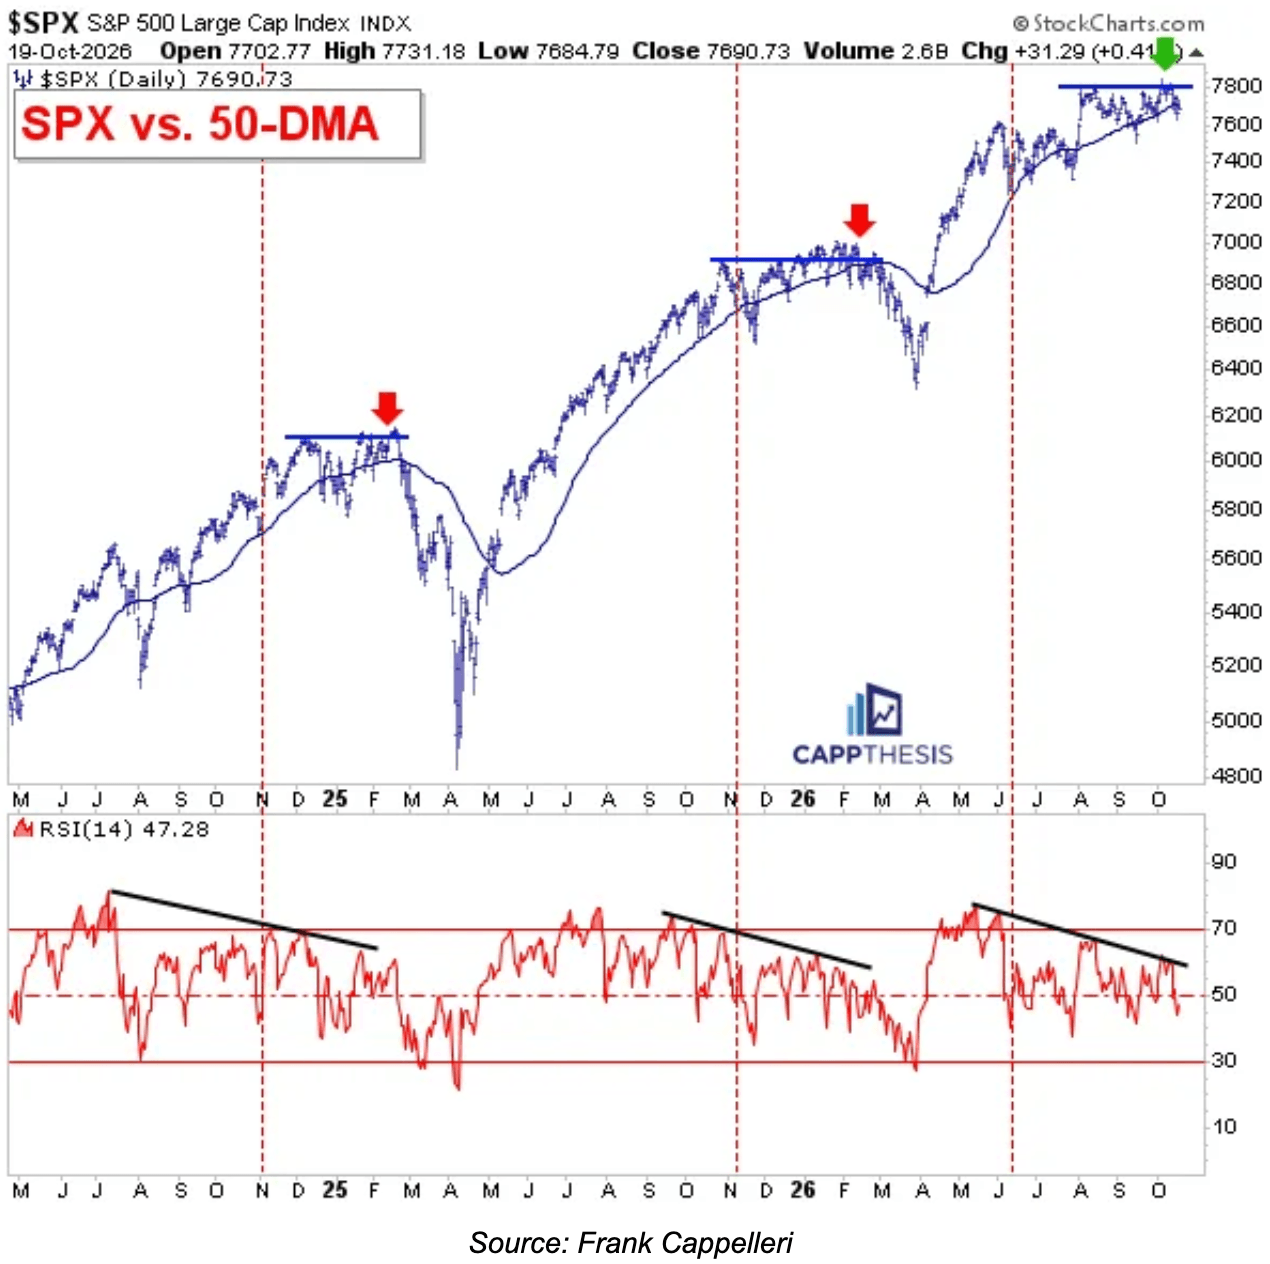
The S&P 500 is showing the same warning signs that appeared before its last two corrections.
Both corrections – marked by the two red arrows – show what happened.
First there was a failed breakout above the resistance levels…
Followed by a breakdown below the 50-day moving average.
At the same time, there was a bearish momentum divergence, as seen by the downward sloping Relative Strength Index line at the bottom.
We’re seeing almost the same setup again, with the S&P falling to break out…
And RSI trending downward.
However, for now at least, the S&P 500 is still holding its 50-day moving average.
And there’s one more thing that’s different from those last two times.
Take a look at the equal-weight S&P 500.
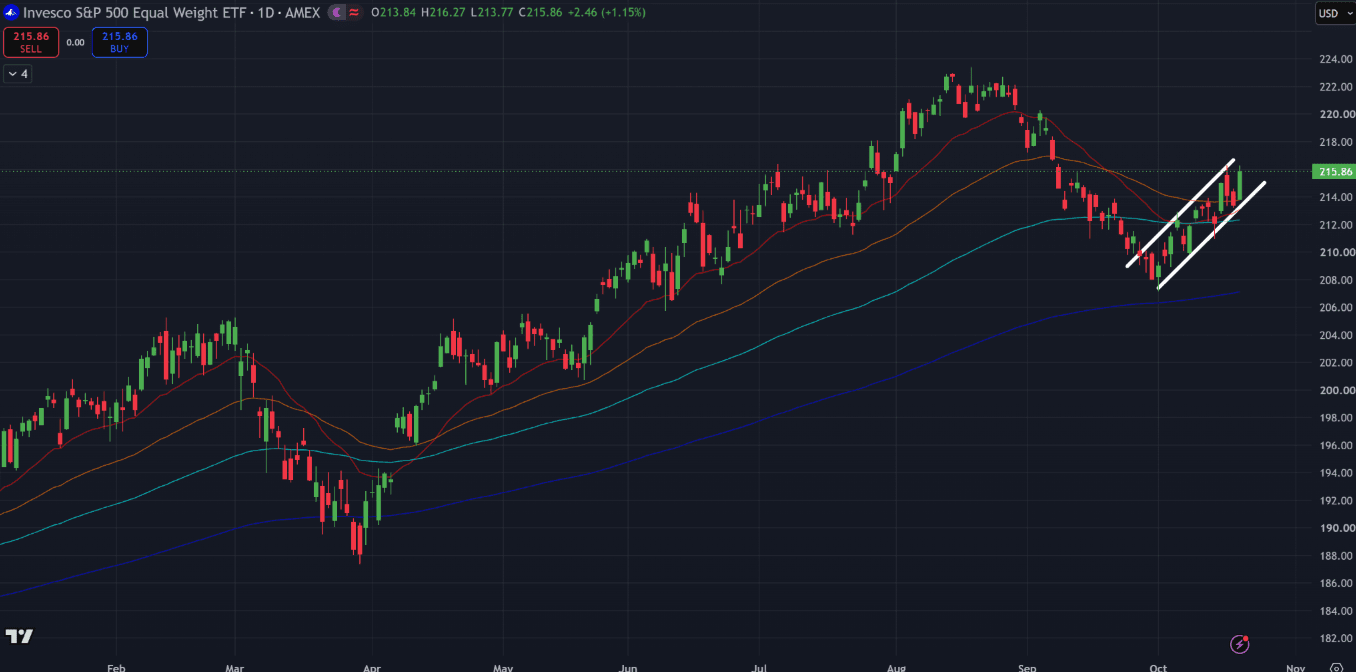
As you know, the Equal-Weight S&P 500 gives each company roughly the same influence, so the biggest tech stocks don’t dominate the result.
While the S&P 500 has been struggling…
The Equal-Weight index bottomed at the beginning of October – and has only trended upward since then.
It’s now at its highest level of the month.
And it’s also reclaimed all of its short and longer-term moving averages (colored lines on chart).
In other words…
We have relative S&P 500 weakness versus relative Equal-Weight S&P 500 strength.
This means while the biggest names are struggling…
There could be a broad-based recovery happening beneath the surface.
I explain the best way to play it – below.
Insight of the Day
A broader recovery makes a good filter essential.
When a handful of giant stocks are carrying the market, everyone knows which names to watch.
As buying spreads to more companies, that changes.
You start seeing stocks you’ve barely heard of moving higher.
Different industries. Different businesses. Plenty of charts that suddenly look interesting.
That’s where I want to be looking.
But a stock bouncing off its lows isn’t necessarily setting up for a big breakout.
And if you buy something just because it’s finally going up, you can wind up chasing a move that’s nearly over.
That’s why, when hunting for explosive breakouts I’m looking for a very specific trigger.
It's a chart pattern that can appear in businesses that have almost nothing in common…
But can point toward some of the most explosive breakouts I’ve seen in my career.
This pattern showed up in Rhythm Pharmaceuticals before it surged 163% in seven weeks.
It showed up in Nine Energy Service before it shot up 270% in 10 weeks.
And I spotted it in Tuniu Corporation before it blasted off by 177% in just 11 days.
A drug company, an energy firm, and a travel business – businesses with nothing in common…
Except one little-known chart pattern that appeared before their stocks took off.
And with a broad-based recovery potentially happening under the surface…
NOW is the time to put this pattern to work for yourself.
That’s why this afternoon at 3 p.m. Eastern, I’m hosting a free LIVE session breaking down this powerful breakout pattern.
I’ll walk you through what the pattern looks like…
What triggers it…
And even reveal the name and ticker of one of our top targets forming it right now.
Click here to lock in your free seat if you haven’t already…
And I’ll see you later this afternoon at 3 p.m. ET.
P.S. If you’re planning to attend on a mobile device, make sure you download the presentation app now so you don’t miss anything when it starts. See you there.
iOS: apps.apple.com/us/app/goto/id1465614785
Android: play.google.com/store/search?q=goto&c=apps
Customer Story of the Day
"I started a few months ago and started implementing the simple strategy with $1000 and have seen a return of over $300.
Ross makes trading very understandable and if you follow along you will make money even with the losers.
Probably the best thing you learn is risk management!"
Embrace the surge,
Ross Givens
See more from Traders Agency on Google
Make us a preferred source and our market analysis will appear more prominently in your Google Search, Top Stories, and AI results.
Add to Preferred Sources