Hey friend,
Stocks are trading today, but the U.S. bond market is closed for Veterans Day.
Tomorrow morning brings weekly jobless claims and October’s existing home sales.
Then on Friday, we get another look at inflation after yesterday’s hotter-than-expected consumer price report.
This time we’ll see how much prices changed for the companies selling those goods and services.
The Daily Direction

Note: Stocks closed lower yesterday on the inflation news – with the medium-term direction for the Russell 2000 dipping back downward.
The Daily Nugget
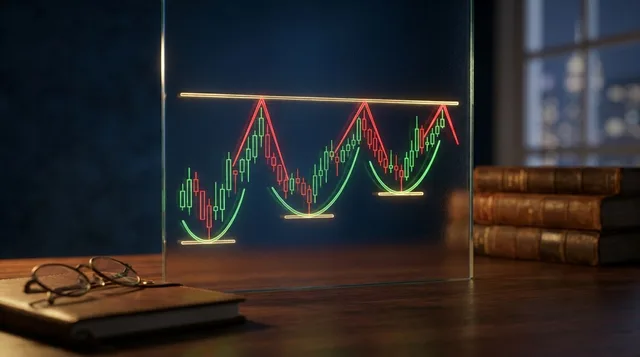
A chart pattern should earn your trust.
Ever notice how easy it is to spot the buy point after a stock doubles?
Somebody circles it on a chart and you think, “How did I miss that?”
Well, you know something now that you didn’t know then.
You know which stock doubled.
Go back to the day before that breakout and cover up the rest of the chart.
Would you have picked that stock out of the bunch?
What you want to see are the other stocks that formed the same pattern.
Include the ones that broke out in the morning and gave it all back by lunch.
Those trades looked good at the time, too.
How many broke out and kept going?
And when a breakout failed, how much did buyers typically lose?
A handful of big winners can still make a pattern worth trading if the losses stay small.
The reverse is just as easy to overlook.
A pattern can work most of the time and still cost you money if one bad trade wipes out several wins.
That’s the kind of record you want to see before you put money on the next one.
The Traders Agency Team
P.S. One breakout pattern earned the No. 1 ranking in both bull AND bear markets.
The guy who gave it that ranking wrote the book on chart patterns.
It’s given our members a shot at gains like 70% in 10 days…
114% in four days…
And even 148% in just two days.
In just a few hours at 3 p.m. Eastern, Head Trader Ross Givens is going LIVE to show you how to spot it.
He’ll even give you the name and ticker of a stock forming that pattern right now.
You’ll see which part of the pattern Ross can already identify…
And what he still needs to see before he’d take the trade.
So click here to guarantee your free seat before Ross goes live at 3 p.m. ET.
See more from Traders Agency on Google
Make us a preferred source and our market analysis will appear more prominently in your Google Search, Top Stories, and AI results.
Add to Preferred Sources