My number one breakout trading strategy follows a simple, repeatable pattern. It dictates exactly when a stock is ready to surge, and it removes the guesswork from your entries.
Most traders sit through agonizing 20%, 30%, or even 40% drawdowns during choppy periods, blindly hoping their stock eventually goes up. That is a losing game. You only want to be in the market during the explosive growth phase — buying right as a stock is ripping higher.
When you learn to spot this specific setup, it does two things for your portfolio. First, it eliminates the dead time spent holding stagnant positions. Second, it greatly reduces your downside risk. Executed properly, you should never need to risk more than 10% to 12% on any given stock.
This is how you stop chasing the market and start anticipating the massive moves before they happen.
The “Shallowing” Pattern
A breakout signal hiding in plain sight on the daily chart
The core of this strategy relies on what I call a shallowing breakout pattern.
To understand how it works, you have to understand how a breakout begins. Typically, you first see a stock making a strong move higher. We’re looking for leading names in leading groups — the stocks that big institutions are actively accumulating.
When a stock experiences a large advance — whether it pushes up 40% or 400% — it naturally creates pent-up supply.
Think about the psychology. You bought a stock at $20 and watched it surge to $30 or $40. You’re up big. You don’t want those gains to vanish. So you take some profits. That wave of selling pressure pushes the stock price down.
But if the underlying demand is still there — if big institutions are still buying — they step in, take advantage of the dip, and drive the price right back up.
This process repeats itself, creating a series of dips and recoveries. The trigger for these pullbacks can be almost anything:
- A sudden analyst downgrade
- A nasty article about the company or the industry
- Some clown on CNBC talking about why he’s bearish on the stock
- Straight-up manipulation — spoofing orders during low-volume periods to run through stops and buy the stock at a discount
Regardless of the catalyst, the visual result on a daily chart is identical. The stock makes a series of dips, and those dips shallow out from left to right.
Anatomy of a Perfect Breakout
Primoris (PRIM) — the textbook example
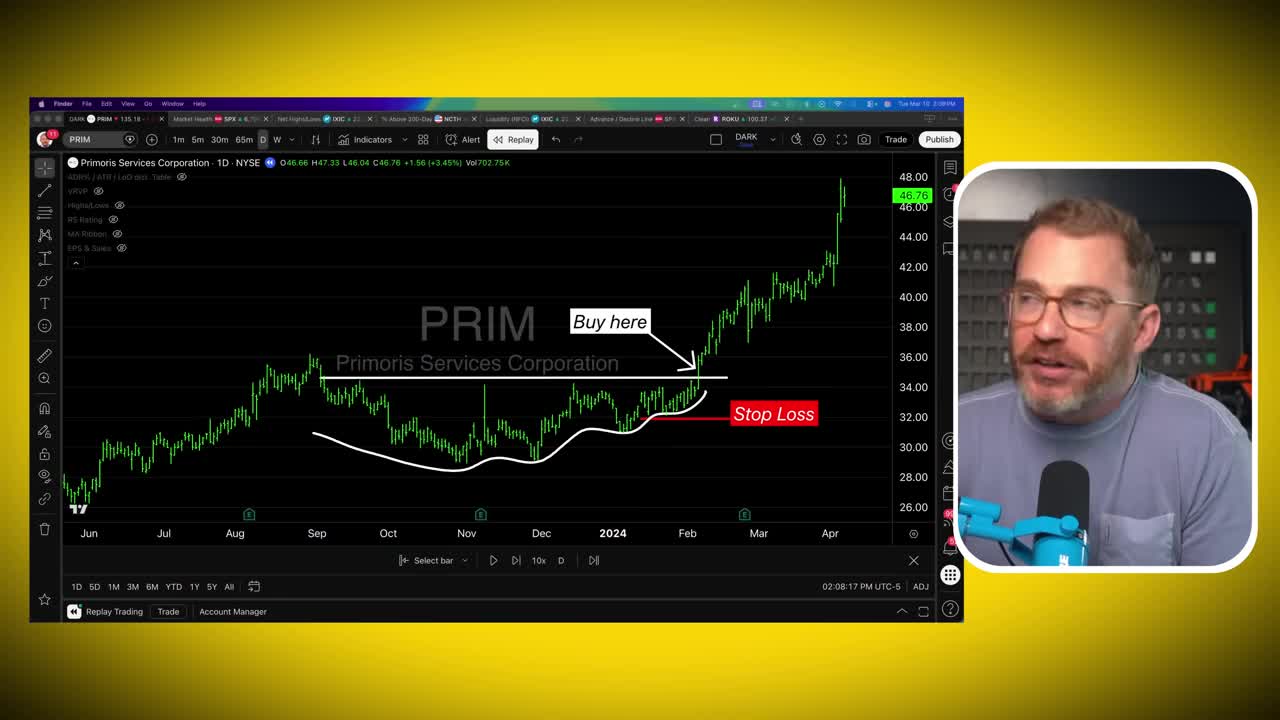
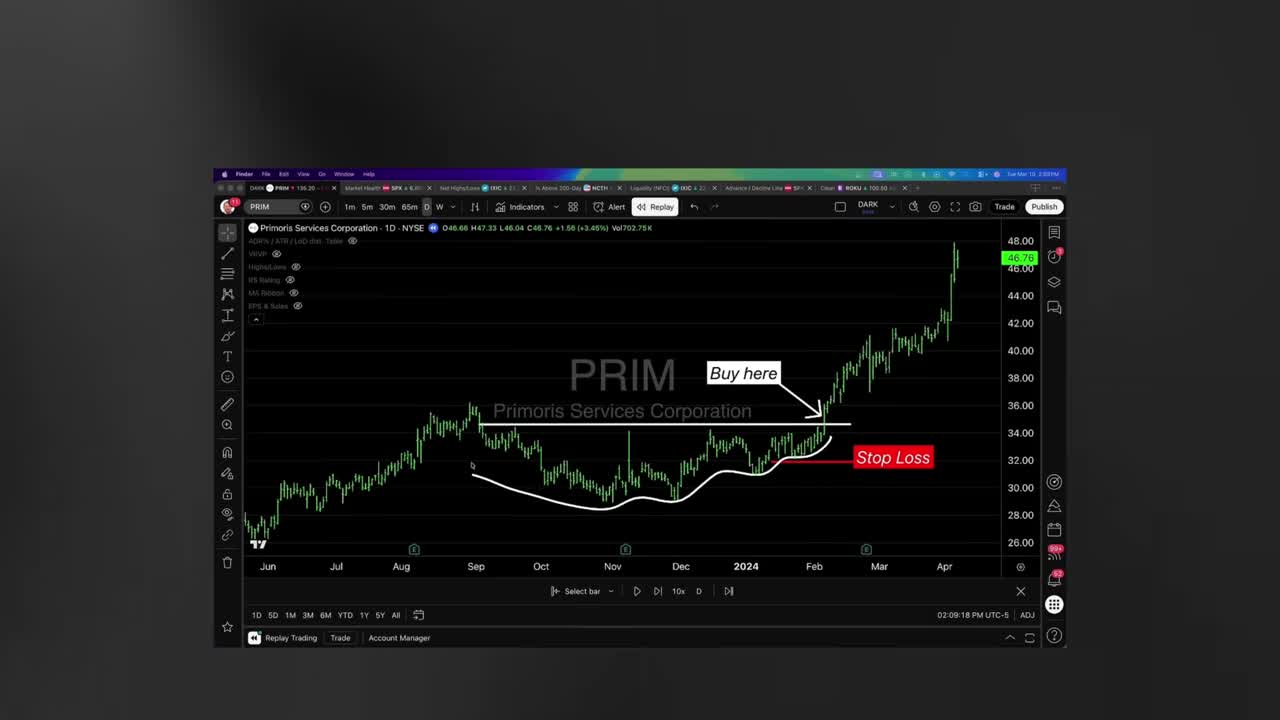
Here are the exact measurements of this shallowing action using Primoris as a textbook example.
On the daily chart for Primoris, the stock hit a horizontal resistance level at about $35. From there, the shallowing pattern formed perfectly:
As this pattern shallows out, it’s screaming a very specific message: there are fewer and fewer sellers left in the market.
The stock is becoming harder to buy. The weak hands have been shaken out, the profit-takers are gone, and the selling pressure has completely evaporated.
The Hidden Hand of Institutions
To trade breakouts successfully, you must accept a hard truth about the stock market: you and I do not move stock prices.
I don’t care if you’re trading a $5 million or $10 million account. You are not moving a stock 70% or 80%. The only entities capable of driving those massive surges are big institutions — the Warren Buffett types, hedge funds, endowments, pensions, ETFs, and big multi-billion dollar shops.
These titans cannot buy stocks the way retail traders do.
If you want a thousand shares of a stock, you log into E-Trade, Fidelity, or Schwab, click your mouse, and you have your shares in half a second. But institutions are buying tens of millions — sometimes hundreds of millions — of shares.
Institutional demand is so overwhelmingly massive that there simply aren’t enough shares offered for sale at any given second. They have to finesse their way into the market — intentionally causing these dips, buying up stock during retracements, meticulously building positions until eventually there is no more stock available.
That’s where the shallowing comes in. Once they’ve gobbled up as much of the float as they can, once they’ve shaken, scared, or bored everyone out of the stock — eventually, if they want more shares, they have to pay a higher price. Would you take $37? How about $38? $40? $42?
That’s what causes these explosive runs.
The simplest way to think about it: imagine a miniature economy where $10 is chasing 10 widgets. Each widget sells for about a dollar. But institutions are buying up all the widgets. Now the same $10 of demand is chasing only two widgets. More dollars chasing fewer shares — the price goes up substantially. Basic supply and demand. That’s what moves these stocks.
Risk vs. Reward on Primoris
The beauty of this strategy is that you don’t need to risk a lot of money.
With the shallowing pattern, each successive dip establishes a higher floor. The stock comes way down, pushes all the way back up — it shouldn’t go back below that level. Another retracement, demand drives it up again — shouldn’t go below there either. So the last swing low is where you place your stop loss order.
Risk a dollar to make three or four, and you only have to be right 25% of the time to come out ahead. Be right even half the time, and you’ll make a bundle of money.
Throughout the run, you simply trail the stop loss — maybe 15-20% below, or along the 50-day moving average — and ride the thing higher until it eventually rolls over and gets you out.
Get an entire year of live weekly mentoring sessions, my newsletter, indicators, bonus reports, tons more. Click the link and I’ll see you in the next live session.
It Works Off the Lows Too
This pattern works both off the highs and off the lows. Since it operates on the basis of supply and demand, you can use it on any asset. It actually works even better on crypto and commodities like gold, silver, and crude oil — because they don’t carry single-stock risk. They operate purely on supply and demand. There is no CEO of Bitcoin that’s going to step down. There is no crude oil earnings report that’s going to come in weak. So they move very smoothly.
Take Rush Street Interactive (RSI). Huge run in 2020-2021, then it got absolutely murdered. But if you wanted to play the turnaround, you could look for this very same shallowing consolidation pattern forming off the lows. The same principles apply — whether it’s pent-up supply from people who are up big, or pent-up supply because everyone hates the stock and it’s getting crushed. Either way, that supply has to get out of the way before the stock can go higher.
The dips get bought. Strong demand shows itself. The pattern shallows, breaks out, and then quickly takes on a big gain.
SMR: A Shallowing Breakout Example
NuScale Power (SMR) is another example of this pattern at work. The same shallowing consolidation pattern formed, and once the supply was absorbed, the stock broke out.
One key confirmation tool: volume. On SMR, you could see below-average volume on the pullbacks and above-average volume on the upward pushes. That tells you institutions are accumulating, not distributing.
Follow the Institutional Money
Leading stocks in leading groups — that’s where the biggest gains live
Big institutions don’t invest like retail traders. They’re not going all-in on some penny stock. They take a macro approach. They identify a theme — say, nuclear power — and decide they’re bullish. There’s a bottleneck in AI development, it’s power, the grid can’t handle it, solar doesn’t have the footprint, the administration is pro-nuclear, there are technological advancements.
So they go buy NuScale Power, they buy GE Vernova, they buy OKLO, they buy the companies that build the mounting brackets and design the software. They buy everything in that space. When lots and lots of dollars flow to certain areas, those areas rise faster than everything else.

Back in 2023-2024, it was semiconductors, semiconductors, semiconductors. That was the AI boom, NVDA leading the march. In March and April of 2025 off those lows, it was nuclear across the board. That’s why you go into SMR.
If you can spot clearly leading areas, you know where to focus. You know where the stocked pond is. Your odds increase dramatically when you’re not only using this pattern and following the law of supply and demand, but also applying it to the stocks that have the wind at their back.
Gold: A Multi-Year Breakout
This same shallowing pattern applies across much larger timeframes too — and across asset classes. Gold formed a massive, multi-year shallowing base pattern. The same principles at work, just on a grander scale.
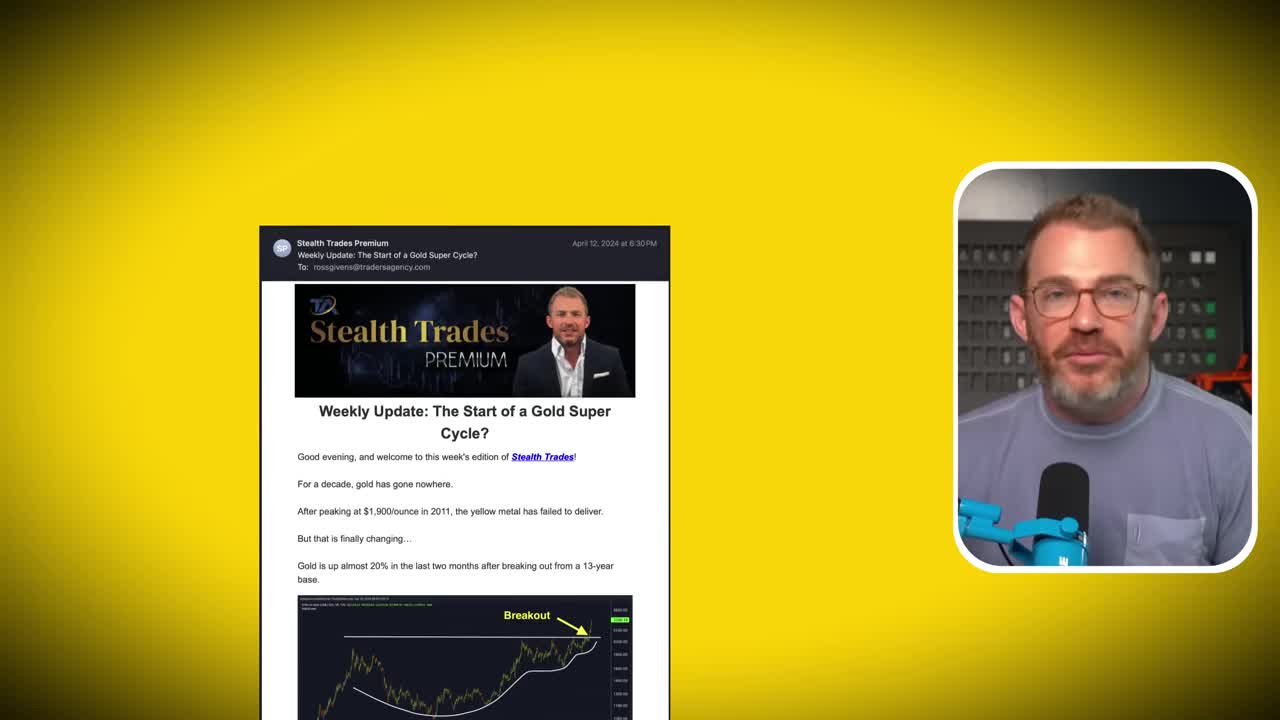
Supply and demand doesn’t care about the timeframe. It doesn’t care about the asset class. The pattern is the pattern. Learn to spot it, and you’ll see it everywhere — daily charts, monthly charts, stocks, commodities, crypto.
The shallowing breakout is boring. It’s not flashy. But it works, because it’s built on the one thing that actually moves markets: the relentless, calculated accumulation of shares by the biggest money on the planet.
Get an entire year of live weekly mentoring sessions, my newsletter, indicators, bonus reports, tons more. Click the link and I’ll see you in the next live session.
DISCLAIMER: Traders Agency does not offer financial advice. The information provided is for educational purposes only and should not be considered financial advice. Traders Agency is not responsible for any financial losses or consequences resulting from the use of the information provided. Trading carries inherent risks and may not be suitable for all individuals. You are advised to conduct your own research and seek personalized advice before making any investment decisions, recognizing the potential risks and rewards involved.