The global precious metals market is entering what analysts call a major super cycle, driven by massive monetary expansion, supply constraints, and rising investor demand. As fiat currencies continue to weaken, gold and silver prices could surge far beyond historical norms — potentially reaching $20,000 per ounce for gold and $500 per ounce for silver in the years ahead.
Outside of wartime or severe crises, money creation has never happened this fast. That reality has massive ramifications for the prices of hard assets.
Why Precious Metals Are Rallying Now
Inflation is caused by one thing and one thing only: printing money. Prices rise when more dollars flood the system, chasing the exact same number of goods and services.
On Friday, the U.S. Bureau of Labor Statistics released January PPI data showing higher-than-expected inflation once again. No surprise there. It is the inevitable result of an ever-increasing money supply.
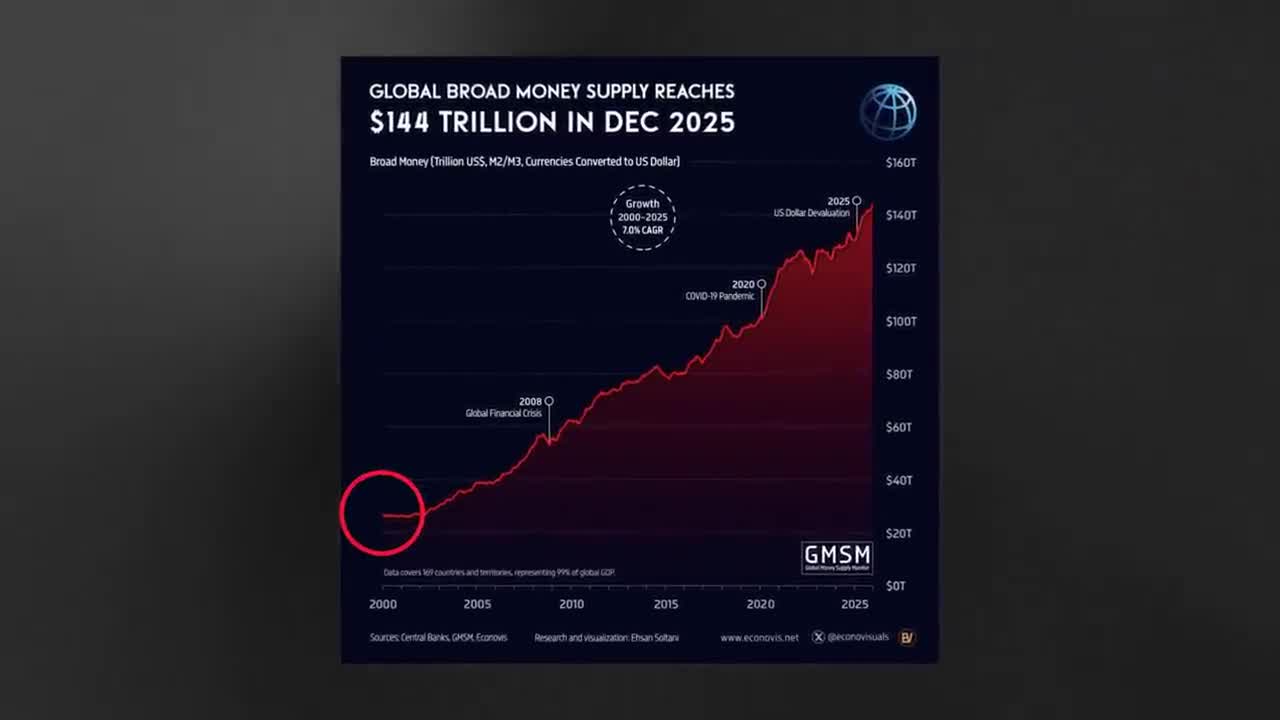
Consider the baseline. Every single dollar on the planet totaled just $26 trillion in the year 2000. Today, that number sits at $144 trillion. The money in existence has grown more than fivefold in two and a half decades — and it continues to surge even during periods of strong economic conditions.
Meanwhile, U.S. debt is over $38 trillion. Government interest payments have tripled in just five years, now costing over $1 trillion annually. Add an ongoing annual deficit of $2.5 trillion, and the math becomes clear.
Governments face only two choices when debt explodes: default or inflate it away. They will never default. They will choose inflation to make the debt smaller in real terms.
The Money Supply and Its Impact on Prices
Gold is the only monetary asset that has kept score for 5,000 years. History proves exactly how it behaves when fiat currencies are aggressively devalued.
- During the inflationary 1970s, gold soared 2,300%
- In the 2008 financial crisis, it jumped 170%
- During the 2020 COVID crisis, it rallied 40%
If gold simply returned to its 1980 money supply ratio, that implies a price of $9,700 today.
The long-term models get even more aggressive. If the money supply grows at 5% annually, models point toward $13,000 an ounce by 2050. If money grows at 7%, those models stretch toward $25,000 an ounce. As extreme as that sounds, there are options trades floating around the market betting on $20,000 gold.
The math simply makes sense.
Technical Trends Support Continued Upside
Gold has been steadily trending higher since early 2024. Last year, the average gold price was $3,400 an ounce. Last quarter, it was $4,100. Today, gold trades for $5,260. This is just the beginning.
The daily chart of gold reveals a consistent, repeating pattern. A strong uptrend, followed by a shallow consolidation that absorbs supply, followed by a breakout to new highs. Over and over again.
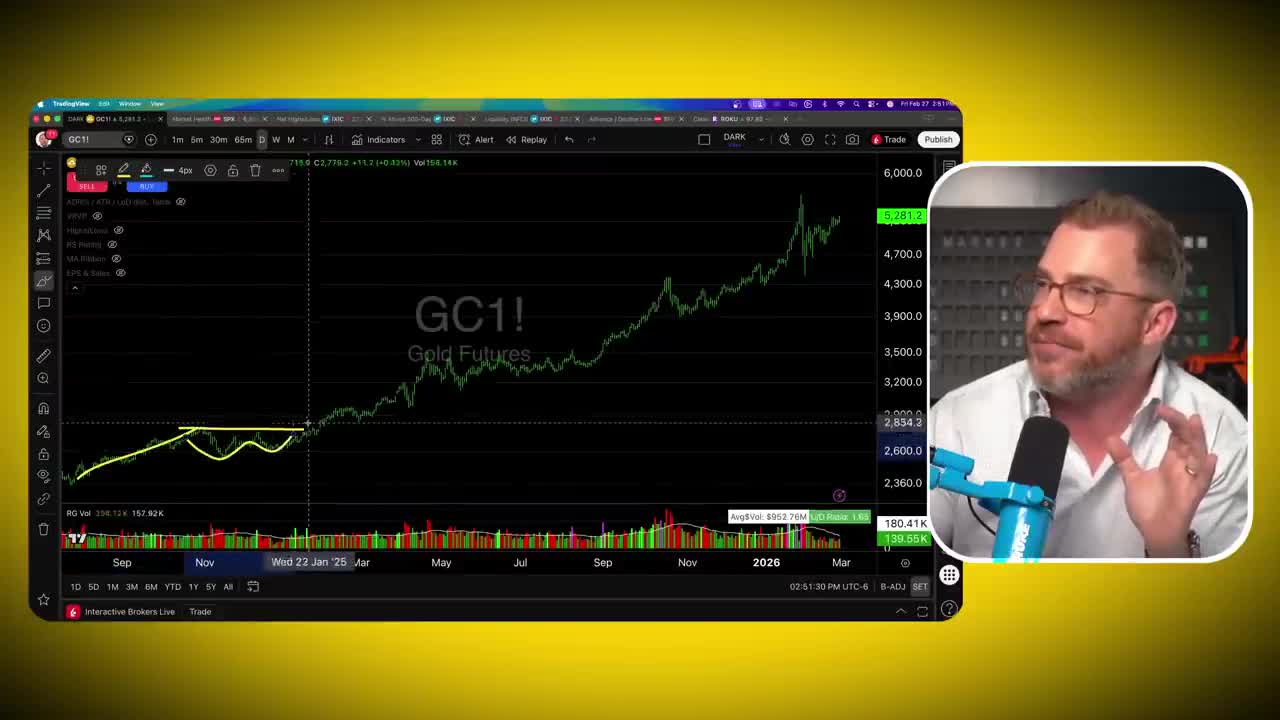
This is the natural flow of supply and demand. Prices rise. Some holders take profits. That supply gets absorbed. Then the price is free to run again. This pattern has repeated on the daily, weekly, and monthly timeframes.
Zoom out to a monthly chart spanning three decades and you see the exact same structure: a massive run-up in the early 2000s, followed by a 15-year consolidation that shallowed in, tightened up, compressed — and then broke out. The current move is the breakout from that multi-decade base.
Silver shows the same setup. It’s more volatile — silver always is — but the same pattern emerges. Sharp moves higher, shallow compression, breakout. From a technical perspective, this is a strong entry point for both metals.
Skin in the Game
In the spirit of transparency — here is my personal physical metals portfolio as of today.
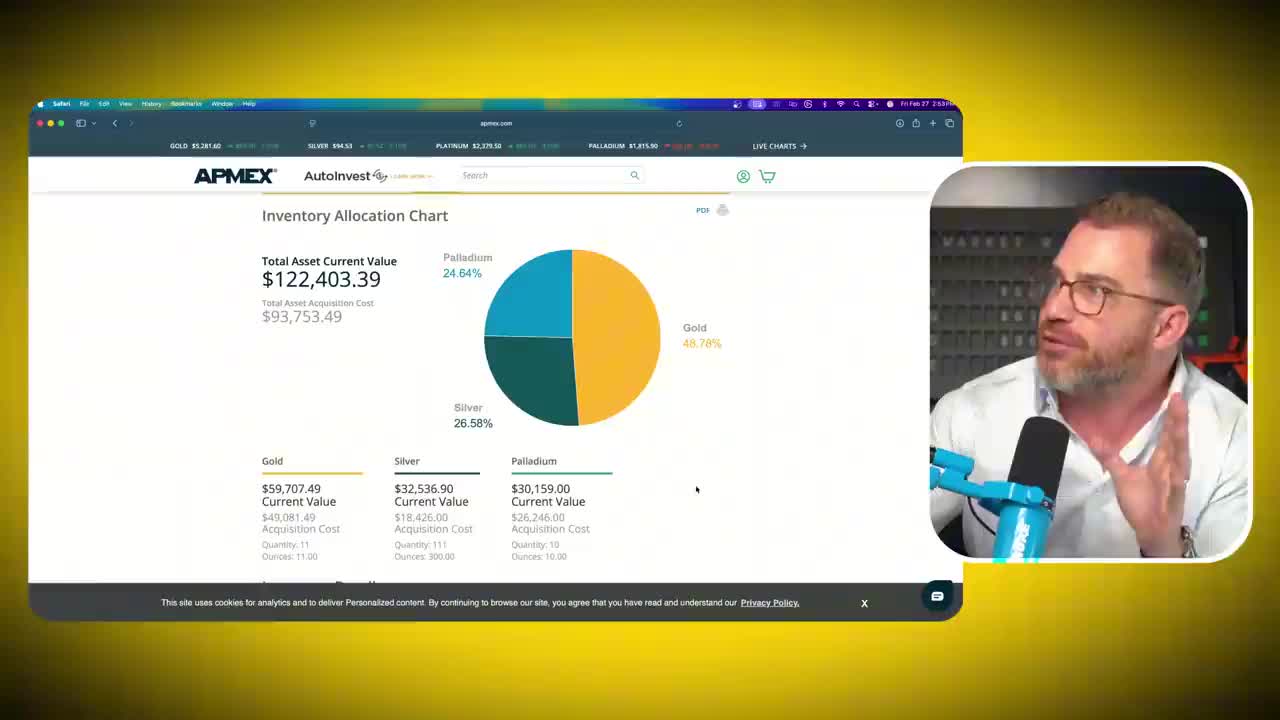
I don’t have nearly as much exposure as I’d like yet. But I’ve been steadily buying pretty much every month, especially on breakouts. Split between gold, silver, and palladium — with a goal of getting over $500,000 in the coming years.
Get an entire year of live weekly mentoring sessions, my newsletter, indicators, bonus reports, tons more. Click the link and I’ll see you in the next live session.
Strong Demand and Tight Supply
All markets — stocks, housing, rare Pokemon cards — function on the principles of supply and demand. When demand exceeds supply, prices go up. Basic economic law. And right now, that is the exact situation in precious metals.
Demand for gold and silver is near the highest ever recorded. Central bank purchases have quintupled since 2022, and they’re expected to buy another 1,000 metric tons of gold in 2026. Jewelry demand is estimated at 1,700 tons this year. Physically backed gold ETFs, seeing record inflows, are set to record 900 tons of purchases for the second consecutive year. That’s not even counting retail buyers who purchase a steady 1,300 tons annually and climbing.
China bought gold every single month in 2025. Goldman Sachs calls this a structural shift. And 95% of global central banks expect their gold holdings to increase.
This is not a phase. This is de-dollarization in slow motion.
A Closer Look at Silver’s Unique Role
COMEX silver inventory currently stands at 82 million ounces — 75% lower than it was in 2020. In one week alone, 47 million ounces were claimed for delivery. Futures traders bought it and instead of closing out the contract, they said: “No, I want it. Ship it to me.”
Silver has been running supply deficits since 2021. The total deficit currently stands at 800 million ounces. That is nearly an entire year of global production — missing.
Industrial buyers used to hold three to four months of supply. Now they hold about one month. AI chips, solar panels, batteries — industrial demand is not slowing. And unlike gold, silver has a true industrial squeeze. The paper market says one thing. Physical inventory says another.
In the end, physical always wins.
Important Considerations for Investors
Gold and silver pulled back last month. They went too far, too fast. Cowboy futures traders got overleveraged and the exchanges raised margin requirements to bring them back to reality. It scared some people out.
That was a dip. And dips — if you’re playing the long game — are a gift.
The same people who sold silver out of fear when it fell to $75 will be buying it back at $175. Happens every time. Nothing goes straight up. Prices need to correct, absorb sellers, and consolidate before starting the next run higher. That is exactly where we are today.
If you’re waiting for another dip to get in, you could be waiting forever. When liquidity expands, when trust in fiat declines, and when physical assets get scarce, precious metals don’t disappear. They reprice. They go higher.
This is a once-in-a-generation opportunity. Don’t miss it.
Get an entire year of live weekly mentoring sessions, my newsletter, indicators, bonus reports, tons more. Click the link and I’ll see you in the next live session.
DISCLAIMER: Traders Agency does not offer financial advice. The information provided is for educational purposes only and should not be considered financial advice. Traders Agency is not responsible for any financial losses or consequences resulting from the use of the information provided. Trading carries inherent risks and may not be suitable for all individuals. You are advised to conduct your own research and seek personalized advice before making any investment decisions, recognizing the potential risks and rewards involved.
See more from Traders Agency on Google
Make us a preferred source and our market analysis will appear more prominently in your Google Search, Top Stories, and AI results.
Add to Preferred Sources