I’ve heard from many of you that want to know more about charting the markets, so that’s what we’re going to cover today.
As you’ll learn, candlestick charts show price movement within a market. Each move, or tick, on the chart carries a certain value.
That’s important to remember as we look for low-risk, high-reward trades!
One of the most important things a futures trader can learn is how to read a chart… Because without them, we’re essentially shooting in the dark.
Nearly all of the information we need to make informed trades can be found on our timeframe charts.
They show us the overall history of a market so we can better predict future price movement.
Once you know what you’re looking for, reading charts will become much easier, so don’t get discouraged.
With that said, let’s dive in and talk about candlesticks and ticks!
Price Action
“Price action” is the term we use to describe how an asset is trading in the market. It is critical information for any trader.
The action on the chart tells you exactly what the price is doing at any given time. As a trader, this should be the first thing on your mind.
And in order to visualize and track price action as we prepare to trade, we use candlestick charts.
It’s also a critical tool in predicting where the price of an asset might move next.
For more information about how I use my charts to predict future price action, be sure to read my article on the subject!
Now, let’s explore the details of candlestick charts and how they function…
Types of Market Candlesticks
A timeframe chart is made up of lots of individual market candlesticks. There are many types of candlesticks, but they mostly fall into either the bullish and bearish category.
When looking at a chart, you will see green and red bars scattered all over the place. They may mean different things depending on the context…
But here are the main ways to interpret the market’s activity through these candles…
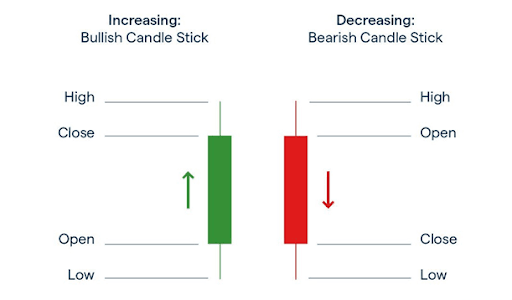
Bullish Candle
A green candle represents a bullish price movement and means that the price has increased over the time period represented by the candle.
Remember: Green means positive price movement.
Bearish Candle
A red candle signifies a bearish price movement and means that the price has decreased over the time period represented by the candle.
Remember: Red means negative price movement.
See the chart below for examples of a bullish candle and a bearish candle…

Timeframe
If you’re looking at a five-minute chart, each fully-formed candle represents five minutes of price action.
On an hourly chart, each candle represents an hour of price action.
And for a daily chart, each candle contains a trading day’s worth of activity, and so on.
These timeframes play a pivotal role in helping us determine when and how we should enter a market.
You can learn more about short-term and long-term trading in this useful article!
Interpreting Charts
As we discussed above, traders are able to garner information about the market from these candles.
They represent time and price and tell you all you need to know about what’s happening in the market.
The rectangular part of the candle is known as the “body.” It shows us the specific price action relating to the opening and closing price.
For a bullish candle, the bottom of the body shows the opening price, while the top shows the closing price, indicating a price increase.
Bearish candles are the exact opposite. The bearish candle’s top is the opening price, while the bottom is the closing price, as the bearish candle is displaying a price decrease.

When looking at timeframe charts, many of the candles will have vertical lines stretching on both ends. These vertical lines are referred to as the “wicks” of the candles.
The wicks indicate the highest and lowest price of the time period represented and give us an idea of the overall price range.
Now, the price range of each candle can be quantified into ticks, which are the overall price movements within a specified timeframe.
Ticks are also how we calculate how much money we can make with a given trade. Each tick represents a value in a futures contract.
The more upward ticks we see in a trade, the more money we make. The more downward ticks, the more risk we take on.
Check out my article on tick values to understand how we use them to make profitable trades.
This is another great resource you can leverage when building your trading strategy!
The Bottom Line
All of the above is some of the basic information required for reading a candlestick chart. All of the data presented on charts is based on price action.
Bullish candles signify that the market is pushing higher as price increases. And if you spot bearish candles, this is interpreted as price decreasing or the market falling.
There are wicks visible on both ends of the market candlesticks, representing the highest and lowest prices.
When you start trying to interpret these candlesticks, they will serve as excellent indicators of traders’ emotions.
When traders are feeling confident in a market, we’ll see more bullish candles. If they’re pessimistic about a market, then bearish candles will dominate the chart.
Smart traders rely on candlesticks to make trading decisions since they can help forecast the short-term direction of price action.
And with ample practice, you’ll be able to read charts in no time and begin making your own predictions about the market.
And don’t miss tomorrow morning’s edition of the Daily Direction as we prepare for another week of trading!
Keep On Trading,

Stay tuned for my next edition of Josh’s Daily Direction.
And if you know someone who’d love to make this a part of their morning routine, send them over to https://joshsdailydirection.
The post How to Master Your Charts with Candles and Ticks appeared first on Josh Daily Direction.
See more from Traders Agency on Google
Make us a preferred source and our market analysis will appear more prominently in your Google Search, Top Stories, and AI results.
Add to Preferred Sources