
In Monday’s Watchlist Update, I explained that the new leaders of the current market environment seem to be biotechnology companies.
Chemical, shipping and energy stocks had their run earlier this year, but as time went on, investors started to look for the next hot sector.
This is sometimes called a “ sector rotation,” and it takes place every few months or so depending on various market and economic conditions.
These rotations can sometimes be hard to spot as they’re happening if you’re not sure what to look for.
After all, they’re not obvious until much later down the road when the once-hot sector starts to lag and the newly hot sector has already seen big inflows.
But if you can get in on the next hot sector before the rest of the market picks up on it, you can do very well for yourself…
Biotech Roundtrip
First, let’s look at the longer-term chart of the SPDR S&P Biotech ETF (XBI), which is an exchange-traded fund tracking the biotech sector.
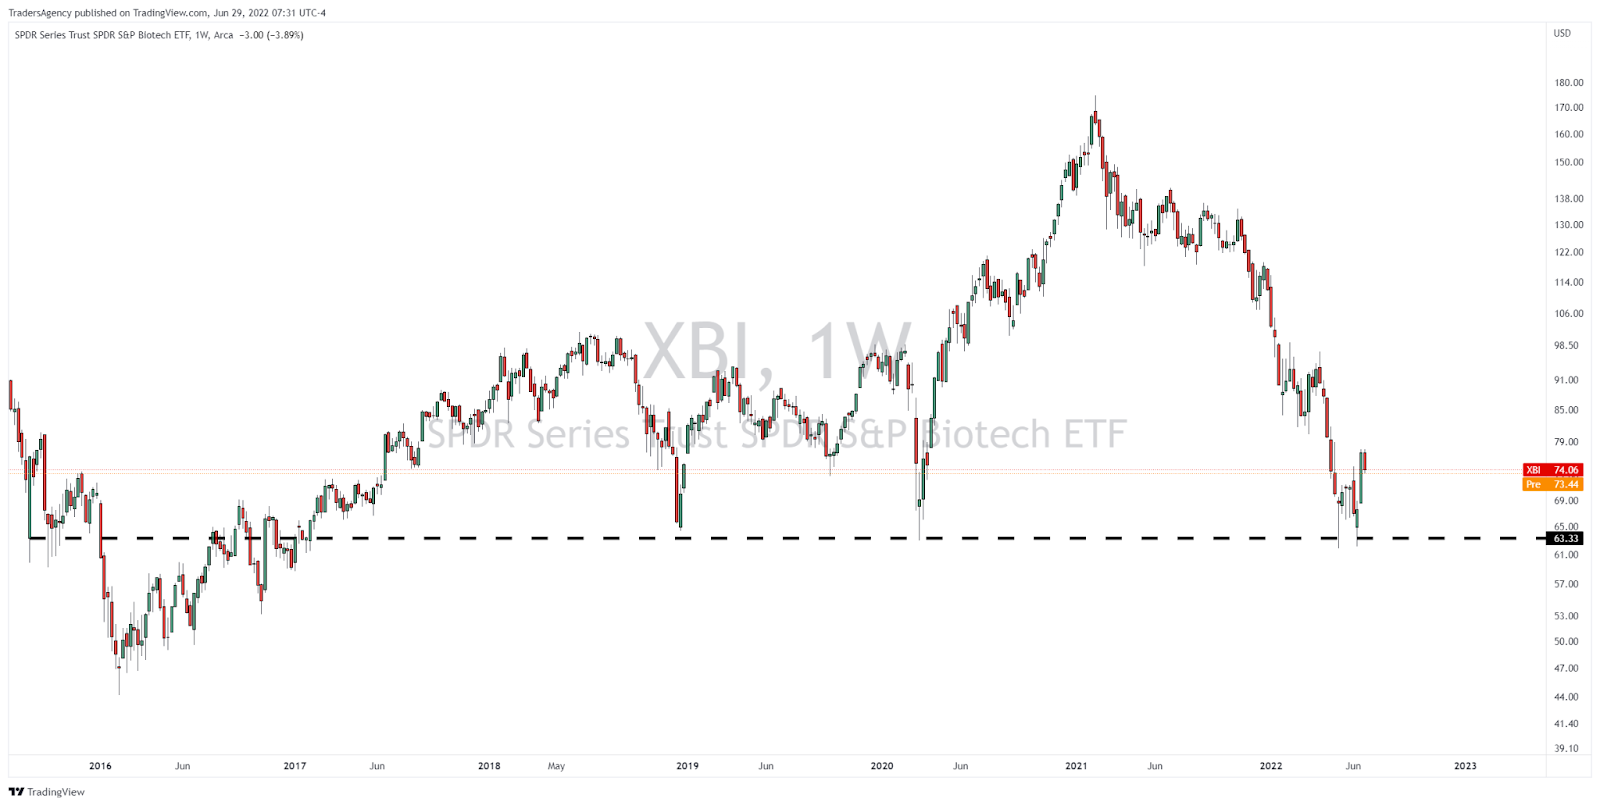
As you can see in the weekly chart above, the XBI is currently trying to hold at support around $63 per share.
This level first acted as support all the way back in 2015 as well as during the pullbacks in 2018 and 2020.
The ETF gained over 175% from March 2020 to February 2021 after the last touch of support, which was a massive move.
But like many of the stocks I talked about last week, all of those gains were erased this year, and the ETF is right back to that same support level again.
Signs of Life
On the bright side, this could provide the base needed for the next major move, as I am now seeing signs of life in this sector again.
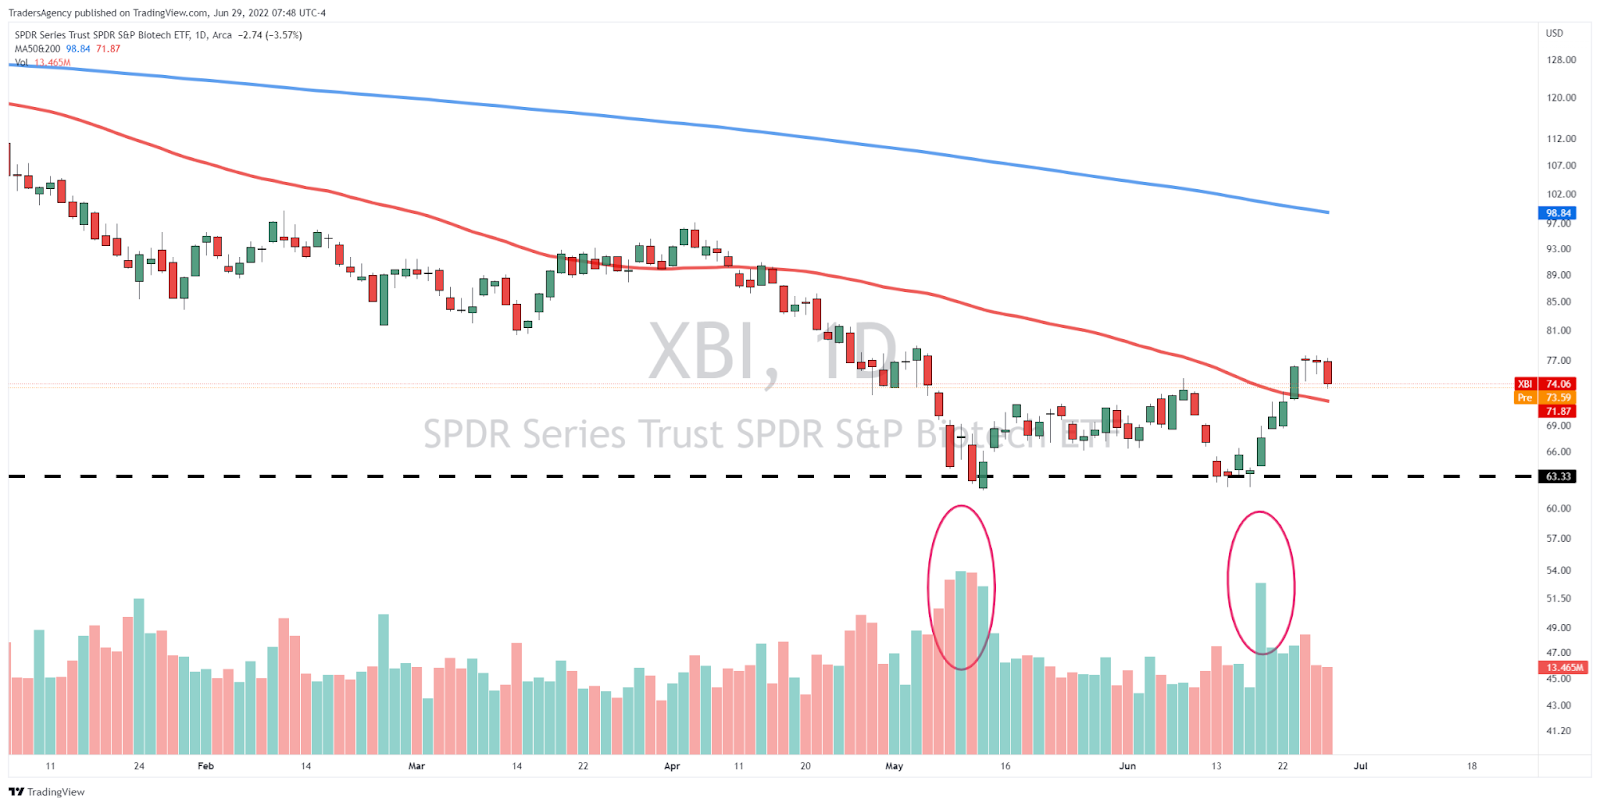
On a daily time frame, XBI has rallied as much as 25% from the recent lows and is now back above its 50-day moving average (red line).
While the 200-day average (blue line) is still looming overhead, it should be quite a while before that level comes into play.
I also want to point out the increase in trading volume at the recent lows. You can see an initial spike in volume as XBI made a short-term capitulation move into early May.
But more importantly, look at the big green volume bar that popped up as the ETF hit support again this month.
This is a very bullish sign in my book, as it tells me that the “weak hands” got shaken out during the downturn and now buyers with stronger hands are taking control.
The Next Market Leaders
Now, I want to briefly revisit the charts for this week’s biotech ideas, Chinook Therapeutics, Inc. (KDNY) and Immunocore Holdings plc (IMCR)…
Just like we saw in the XBI fund, we can see that there were big volume spikes in both of these biotechs in June.
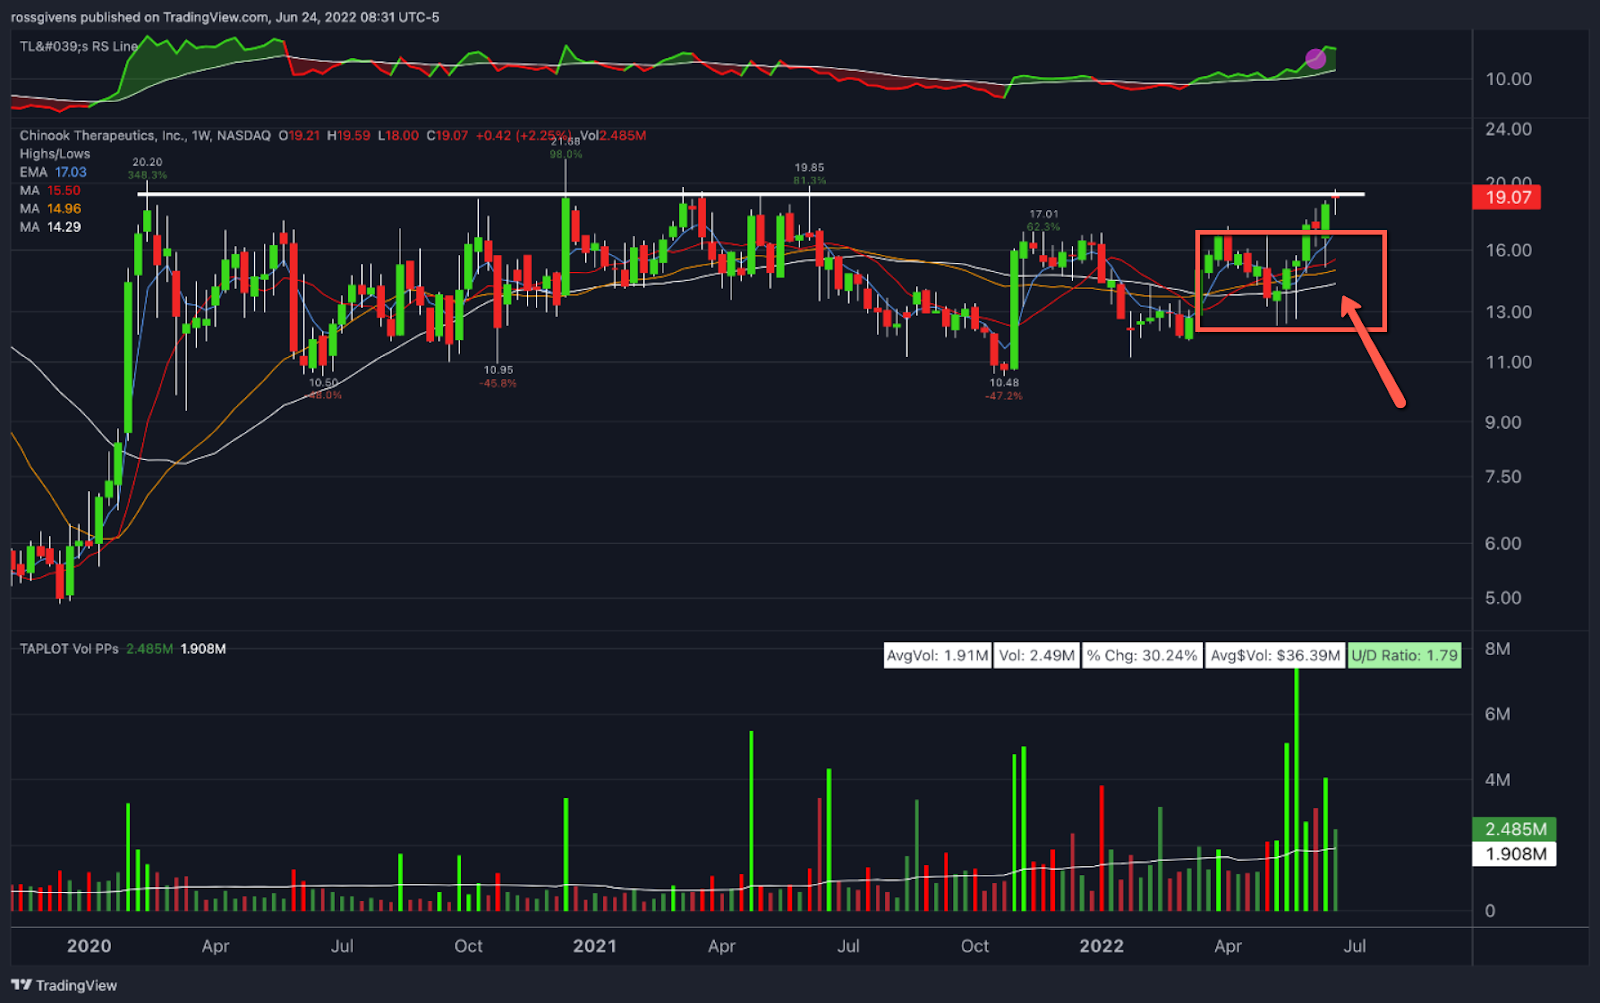
In fact, KDNY has seen a bunch of outsized green volume bars over the past few years during the stock’s consolidation.
This is one of the footprints of heavy institutional buying, which is a very bullish sign.
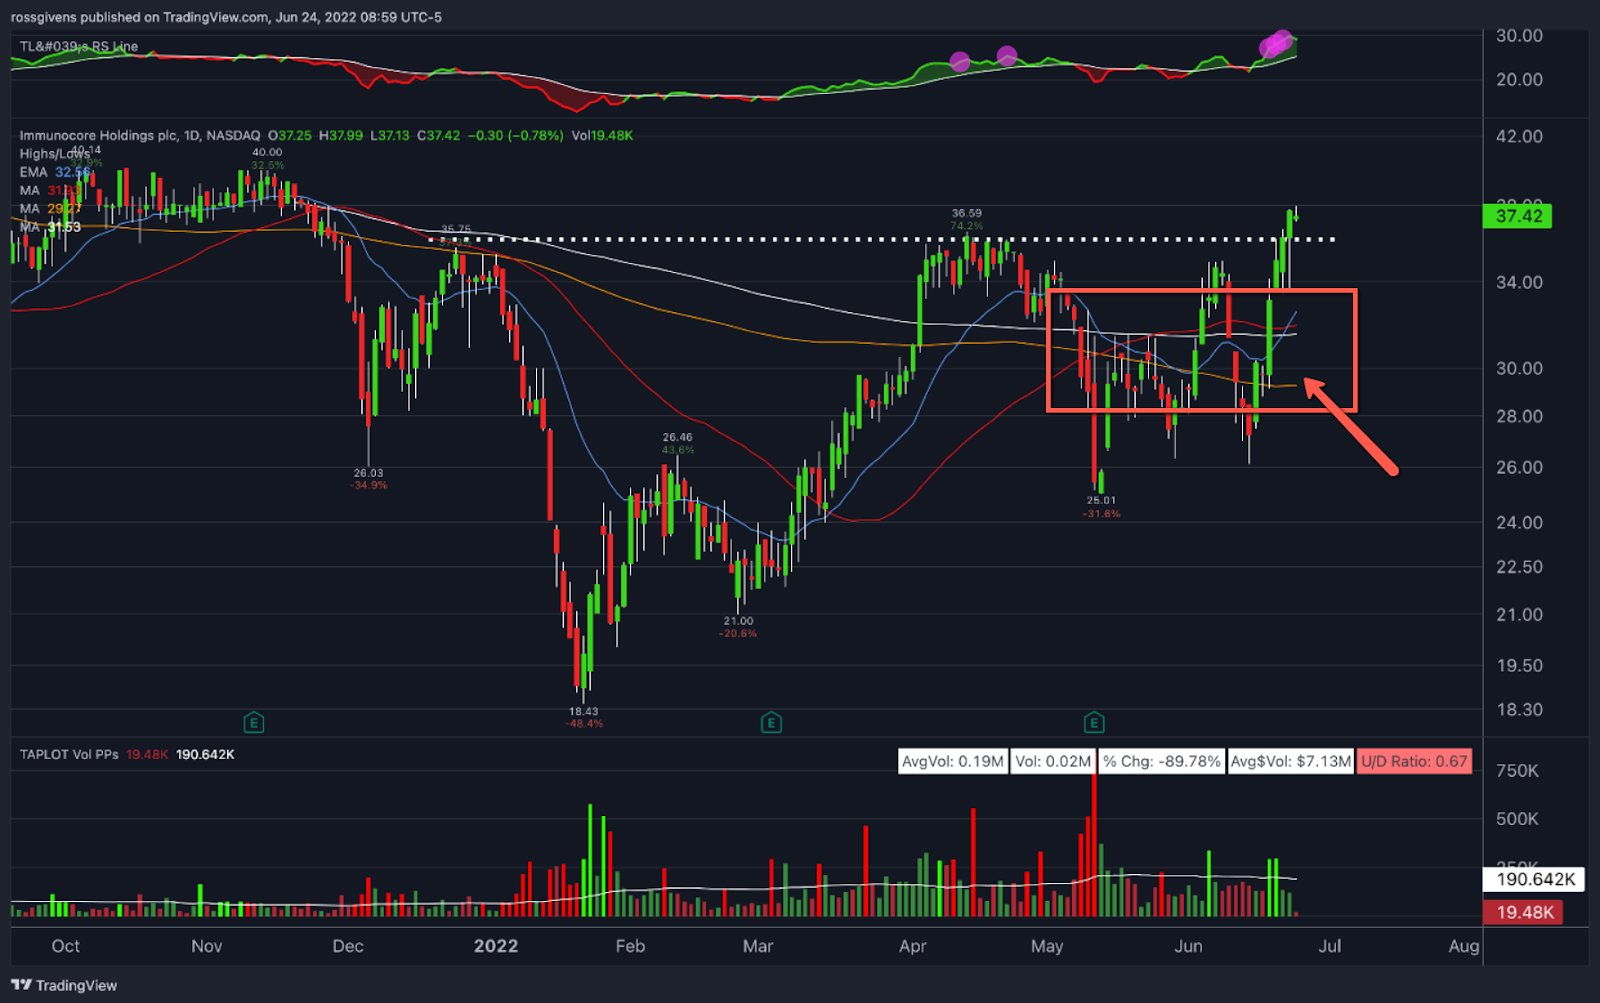
IMCR has also seen big volume come into the stock… first at the early 2022 lows and again in June following the shakeout around earnings in May.
This is all great to see and why I included these stocks on the Watchlist this week.
But what I didn’t point out on Monday was how compressed the moving averages have become for these stocks and what that means to me…
Building a Launchpad
While we have two different time frame charts above, one a daily chart and the other a weekly chart, the idea is the same…
You can see that as these stocks consolidate, their moving averages are compressing and moving closer and closer together.
That makes sense because when price action stays in a tight range, the moving averages will naturally move towards that price area.
But what’s important right now is that not only are the relevant moving averages converging, but these stocks are both consolidating above all of those moving averages.
This creates a launchpad where the stock can take off from as well as a strong confluence of downside support.
If either of these stocks is able to break through their upper resistance boundaries, which I expect they will, we should see them blast off from their launchpads and ride the moving averages higher.
These stocks could move quickly, so I’ll do my best to keep you posted as they start to rally.
For now, both ideas are still in play, so continue to follow the trade plans outlined in Monday’s Watchlist.
A Major Market Loophole
Before I sign off, I want to tell you about what my colleague and expert trader Josh Martinez describes as possibly “the world’s most profitable side job”…
Josh is absolutely meticulous in his approach to the markets, and he has years of experience teaching his students how to manage risk.
He recently found a digital currency move that doesn’t require a fancy account, wallet or complicated setup…
It’s a little-known loophole in your brokerage account.
Click here to get all the details on this explosive opportunity right now…
Embrace the surge,

Ross Givens
Editor, Stock Surge Daily
The post How to Spot Sector Rotation Before the Next Big Move appeared first on Stock Surge Daily.


