

The S&P experienced a decent bounce of 2.6% last week. And since the recent bottom on June 17, the index has rallied as much as 10.3%.
However, with the pullback we’ve seen over the past couple of sessions, the index is currently just 7.8% off its low.
Some of that pullback may be in anticipation of today’s Federal Open Market Committee (FOMC) meeting, where it is expected that the committee will raise the federal funds target rate by 0.75% to a range of 2.25%-2.50%.
As regular readers know, higher interest rates are generally bad for stocks, so today I want to take a look at the S&P 500 to get a better idea of where the index could go from here.
I’ll also cover each of the stocks from this week’s Watchlist and let you know how they’ve been shaping up since Monday.
Broad Market Moves
First off, the S&P closed yesterday’s session right on its 50-day moving average (red line)…
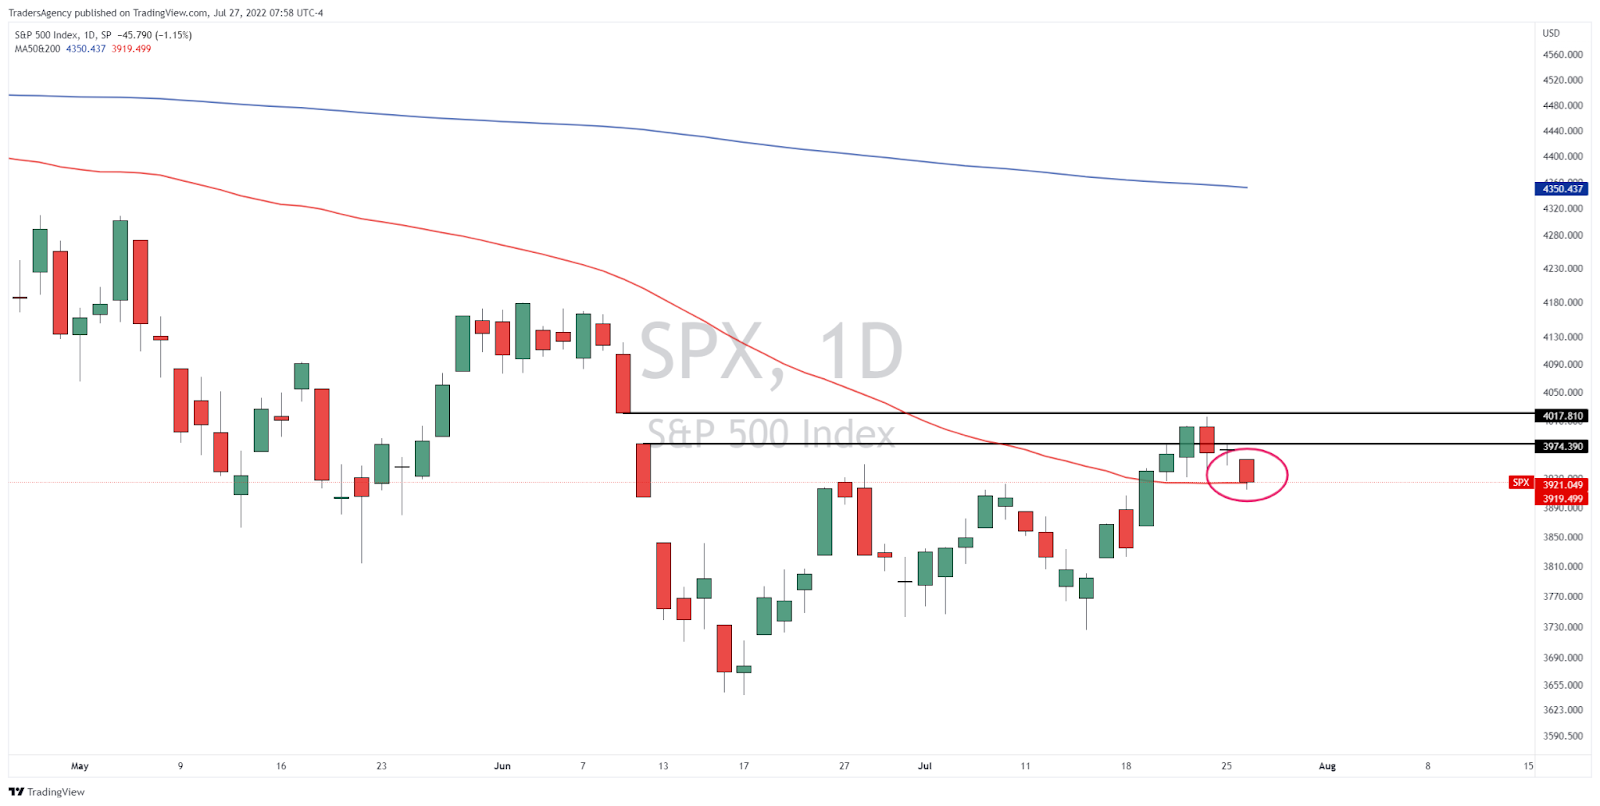
The index attempted to break through the area that was formed by the gap-down on June 10, but that’s when the current rally started to stall out.
Now, the index is sitting right on its 50-day moving average, which should provide some support for the bulls.
If this level holds, I will be looking for a move up to the next major resistance area around 4,170.
If this level does not hold, however, I will be looking for a move back down towards the recent lows.
However, our Watchlist stocks are bucking the bearish trend this week, which shows why it’s so important to know what you’re looking for in a market like this.
Enphase on the Move
First up, let’s look at Enphase Energy, Inc. (ENPH), which is one of my favorite solar stocks.
Here, we were looking for a move above the pivot area at $220…
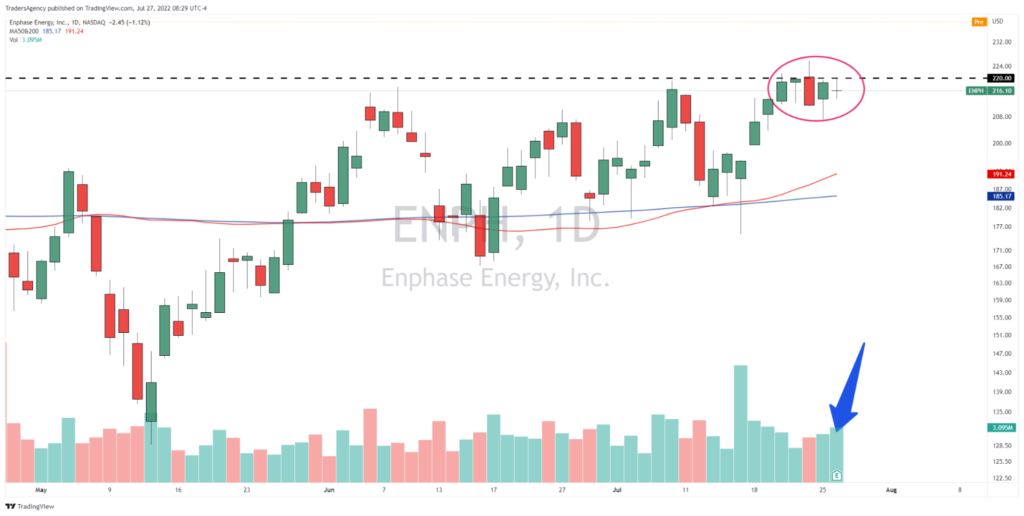
The stock rallied almost 3% at the open last Friday and crossed above the $220 level before pulling back below that level into the close.
On Monday and Tuesday, the stock erased some of those losses as investors looked ahead to earnings on Tuesday evening. But the stock never got up to or through $220 in the past two sessions.
However, the company issued a positive earnings report after the close yesterday, which is pushing the stock up by 10% in pre-market trading today.
So, if you took the trade early as the stock was pressing against $220, consider moving your stop up to break even levels.
If you missed the big move this morning, consider sitting on the sidelines until the move works itself out and the stock sets up again.
Primed for a Big Break
Next up is McKesson Corporation (MCK). For this idea, we were looking for a move above $336 with a stop loss about 6% below the entry.
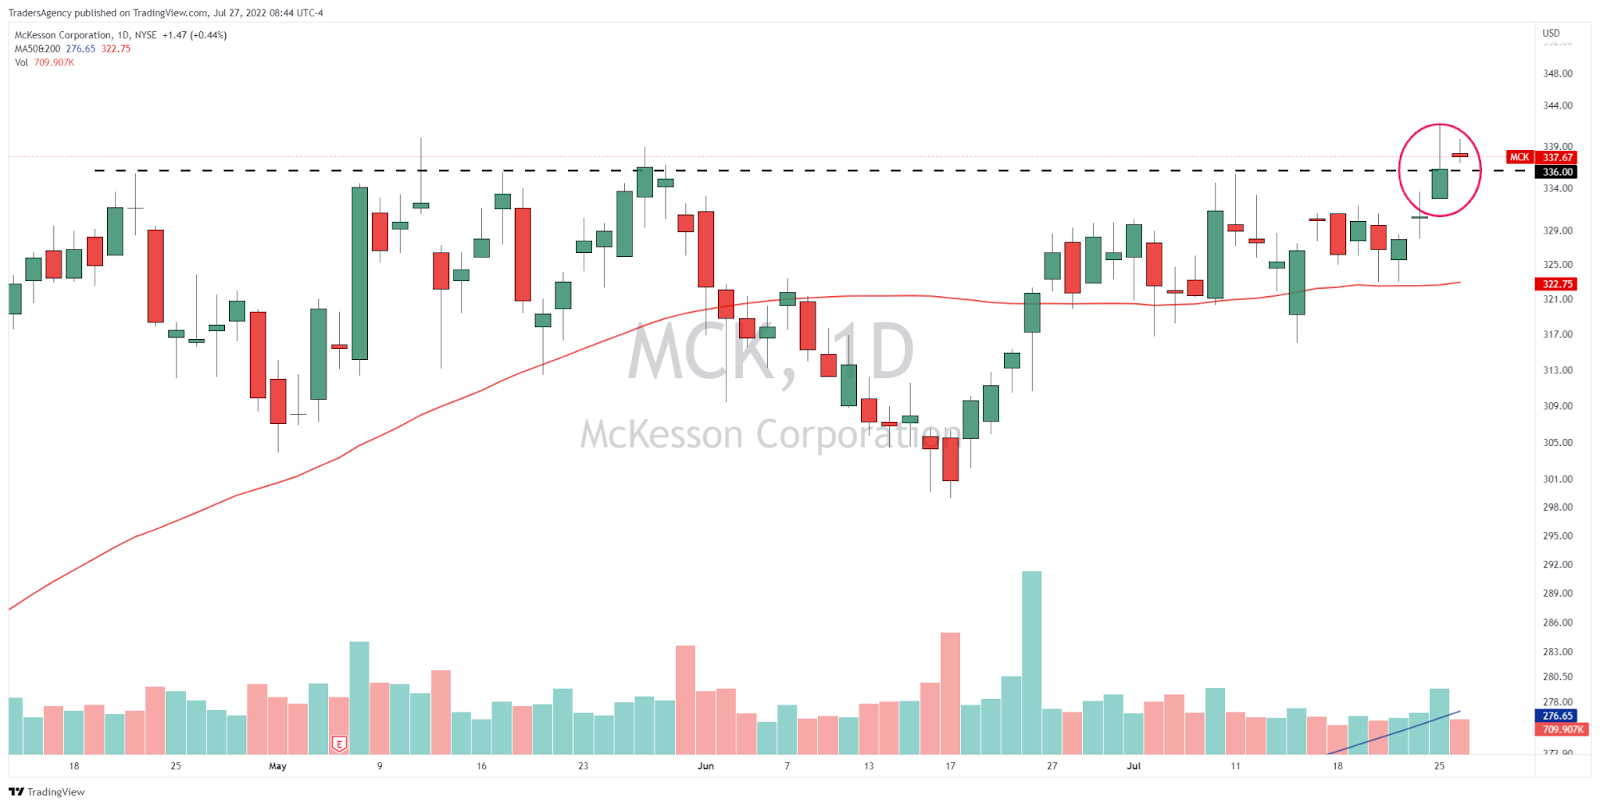
When I published this idea on Monday morning, MCK stock was looking primed for a breakout.
The stock had just rallied off of its 50-day moving average after holding above it for several weeks.
When the opening bell rang on Monday, the stock started to push to new all-time highs.
However, as the market stalled out, MCK also pulled back to close the day right on the $336 level we were watching.
Then, in yesterday’s session, we saw another push above the pivot level and a close at $337.67.
If you took this trade, keep holding while keeping your 6% stop loss in place.
Breaking the Consolidation
Lastly, we have Consolidated Water Co. Ltd. (CWCO).
For this idea, I explained that I would consider buying if CWCO trades above $15 on above-average volume.
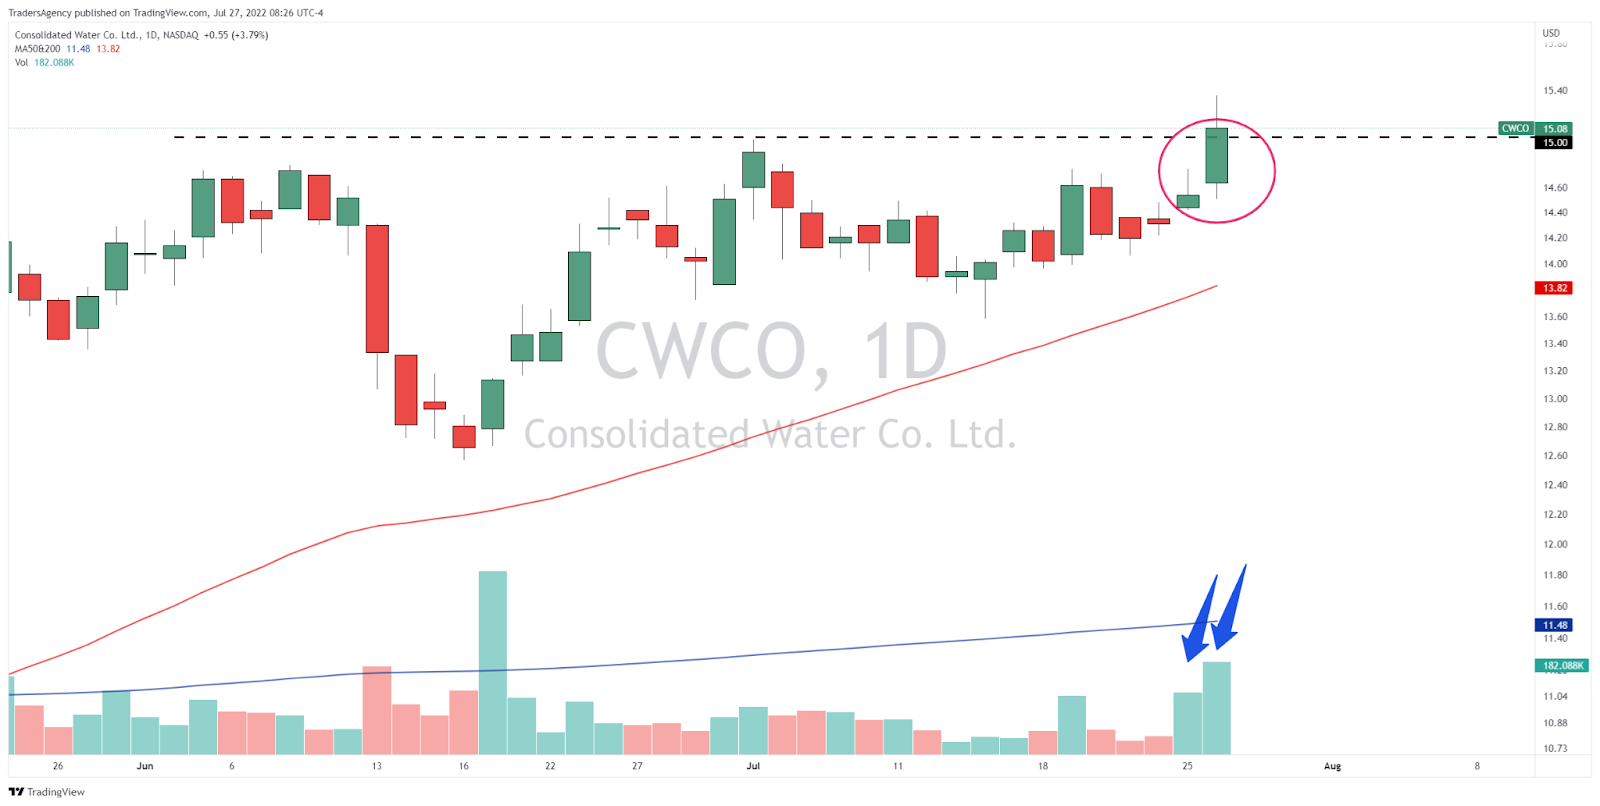
As you can see in the chart above, that’s exactly what we got… The stock gapped higher by 1.6% on Monday, but yesterday was an even bigger day.
CWCO rallied through the $15 level and hit a high of $15.35 before pulling back a bit.
Both up-days were accompanied by above-average volume, which was great to see.
I do not have a stop loss recommendation for this idea. But if you took the trade, be sure to manage your risk responsibly.
Did You Miss the Premiere of “Operation: FIRE Trader”?
Before I end today’s thoughts, I wanted to tell you about my breakthrough training event I held yesterday.
You see, while the country may seem in shambles at the moment…
There’s still a small group of traders who have consistently used a prophetic trading sequence to help them snatch gains of 941%… 1,379%… and 49,900% in both bull AND bear markets.
And since I’ve personally leveraged this same method to grow my own nest egg…
I’m officially shedding a light on this groundbreaking tool that’s infamously known for being “The #1 Best Performing Trading Strategy of All-Time…”
In fact, based on a 1,012 page white paper study done by expert analysts…
They found that out of 307 different occurrences this sequence occurred in the market… EVERY SINGLE TRADE rose in profit.
This is a HUGE deal…
Which is why, given the circumstances…
Having a dependable and precision accurate strategy in your arsenal is more important than ever.
Again, this is my most anticipated event I’ve ever put on at Traders Agency…
So, you’ll definitely want to make sure you watch to see all of the evidence I share.
Embrace the surge,

Ross Givens
Editor, Stock Surge Daily
The post In a Market Like This, Knowing What to Look For is Key appeared first on Stock Surge Daily.
See more from Traders Agency on Google
Make us a preferred source and our market analysis will appear more prominently in your Google Search, Top Stories, and AI results.
Add to Preferred Sources