Hey, Ross here:
After 200 days trading above its 50-day moving average – one of the longest streaks in history – the S&P 500 has closed below it two days in a row.
So let’s look at what the data tells us about what tends to happen when such historical streaks end.
Chart of the Day
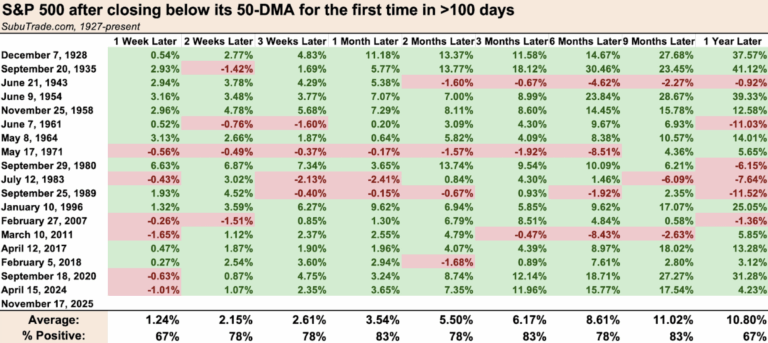
This chart shows how the S&P 500 has performed across various timeframes ranging from a week to 12 months after a 100-day streak above its 50-day moving average has ended.
Most people might think that the ending of such a long streak would be historically bad for the markets…
That it would most likely be the start of a severe correction or even crash.
But as the data above shows, this is far from the case.
Just look at the amount of green on that chart.
Even in the shorter term, the odds still skew positive.
Of course, past performance is no guarantee.
And in the current scenario, I believe a healthy correction is more than warranted.
So, even if the market keeps pulling back from here?
I’m not worried.
In fact, it’s exactly what’s needed to wipe all this froth off.
The bull market still has many months left.
As for what to do in the immediate term?
I explain below.
Insight of the Day
Focus on targeting stocks that can move independent of the trend.
The current short-term trend is sideways at best – and possibly heading lower.
And while there are certainly sectors that are still performing…
Even those trends have heavily weakened.
That’s why right now, the smart move is to target stocks that can move independent of the trend.
That’s no easy task…
Because it means that stock would need to have a powerful catalyst that could allow it to defy the broader trend.
A prime example of such catalysts? Earnings.
That’s why during earnings season – which we’re still in now – stock prices can make such big moves, regardless of the trend.
Of course, by the time such catalysts are made known to the public – the stock’s price would already have moved.
So the key is being able to identify these stocks before then.
The charts can’t help you here…
Because by the time you see it in the charts, it’s already been priced in.
It’s almost impossible for any ordinary trader to do this.
But it’s just a regular day in the office for the corporate insiders…
The CEOs, CFOs, and board members who already know about these upcoming catalysts in their own companies…
And yet are openly allowed to trade their own company stock.
For instance, Nvidia is due to report earnings today after the closing bell.
And yet, its executives have been selling stock like crazy for the past two months.
Think now is a good time to get in?
Trust me, there are way better opportunities right now.
And later this afternoon at 3 p.m. Eastern…
I’m going LIVE to walk you through my exact strategy for spotting them, including:
- Where to find insider trades – publicly and legally
- How to tell which ones matter (and which to ignore)
- The 3 unusual signals that insiders leave behind when they’re confident a stock is about to move
Despite the market pulling back, insider buying activity has actually been increasing.
And that’s pointing the way to opportunities even in this pullback.
So click here to lock in your spot for my live insider strategy walkthrough if you haven’t already…
And I’ll see you this afternoon at 3 p.m. ET.
P.S. If you’re planning to attend on a mobile device, make sure you download the presentation app now so you don’t miss anything when it starts. See you there.
iOS: https://apps.apple.com/us/app/goto/id1465614785
Android: https://play.google.com/store/search?q=goto&c=apps
Customer Story of the Day
“I am new at trading and have bought many programs. Ross’ training is bar-none.
Ross is the first one I actually placed trades with.
I only do one contract at a time and I am up $500 my first week. My first trades were life changing to me!
Thank you! Ross and your Team…”
Ross Givens
Editor, Stock Surge Daily