
The markets kicked off the new week yesterday by erasing Friday’s losses.
However, the bulls still have a lot of work to do to make up for last week’s bloodbath.
In the meantime, I want to talk about a bearish chart pattern that could help you play further downside in the market.
We covered the bullish variation two weeks ago, but today we’re going to see how this pattern develops and plays out on the bear side…
Descend to New Depths
Today, we’re going to cover the “Descending Triangle” pattern, which is the bearish variation of the “Ascending Triangle” chart pattern we covered on Sept. 6.
This is also a continuation pattern, meaning that the breakout from the pattern is usually in the same direction as the prior trend.
A great recent example can be found in Meta Platforms (META), formerly known as Facebook.
As you can see in the weekly chart below, META has been falling for quite a while…
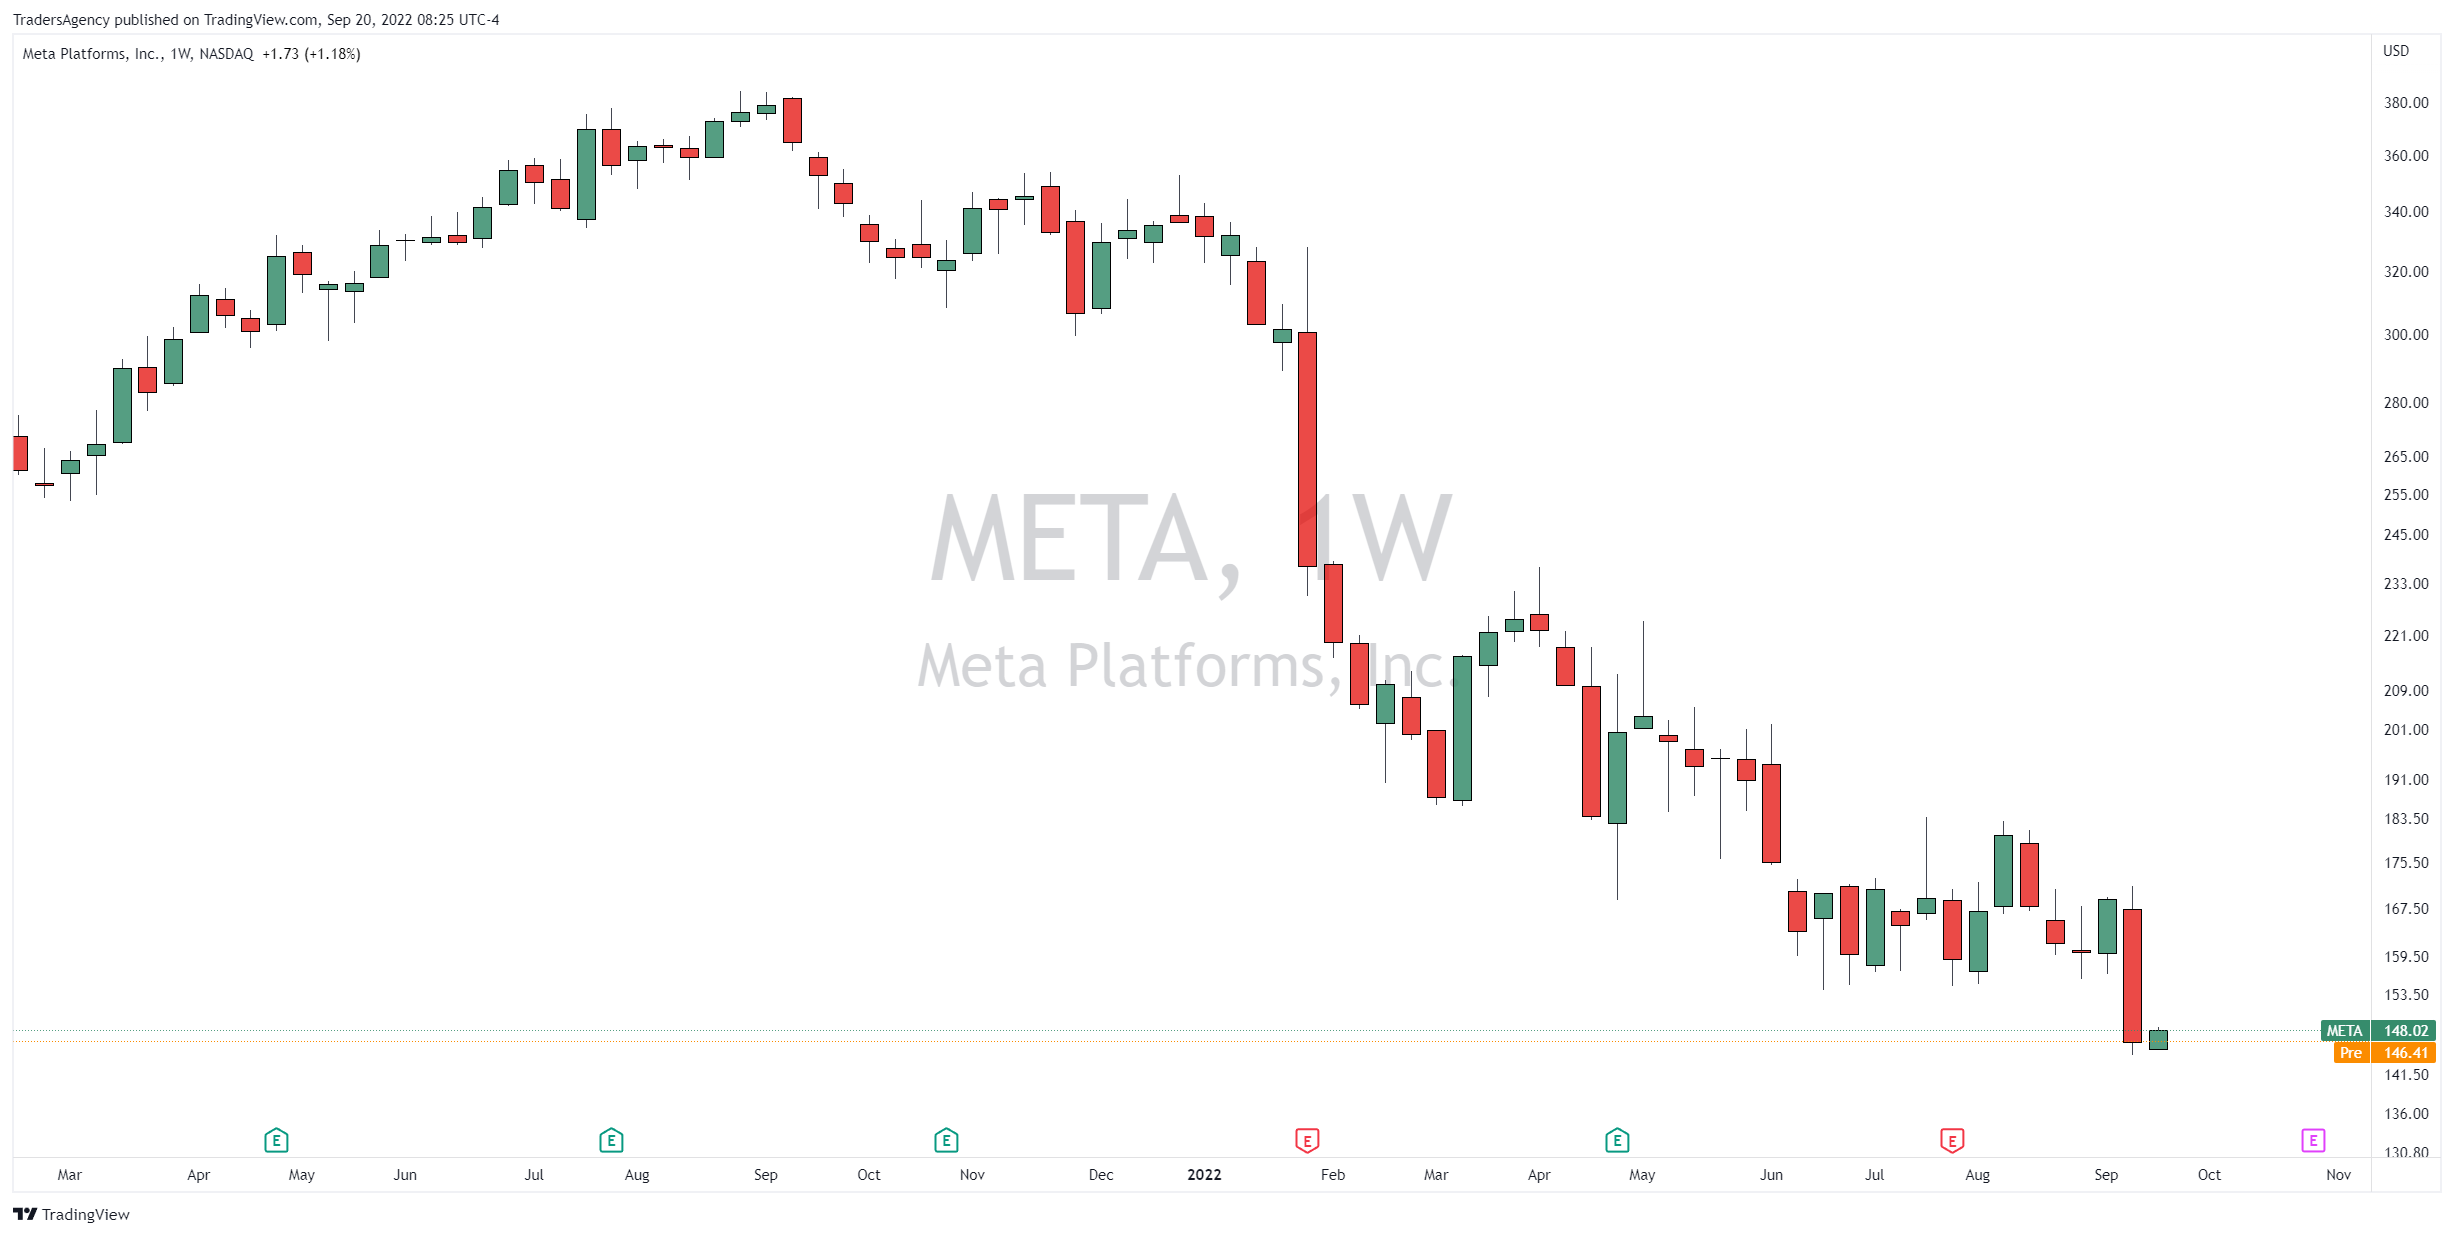
The company has had its fair share of problems, and the name change hasn’t seemed to help its reputation much.
The stock was down 60% from the all-time high through the start of September, but now it looks like another leg lower is coming.
Just take a look at the descending triangle pattern that just completed on the daily chart below…
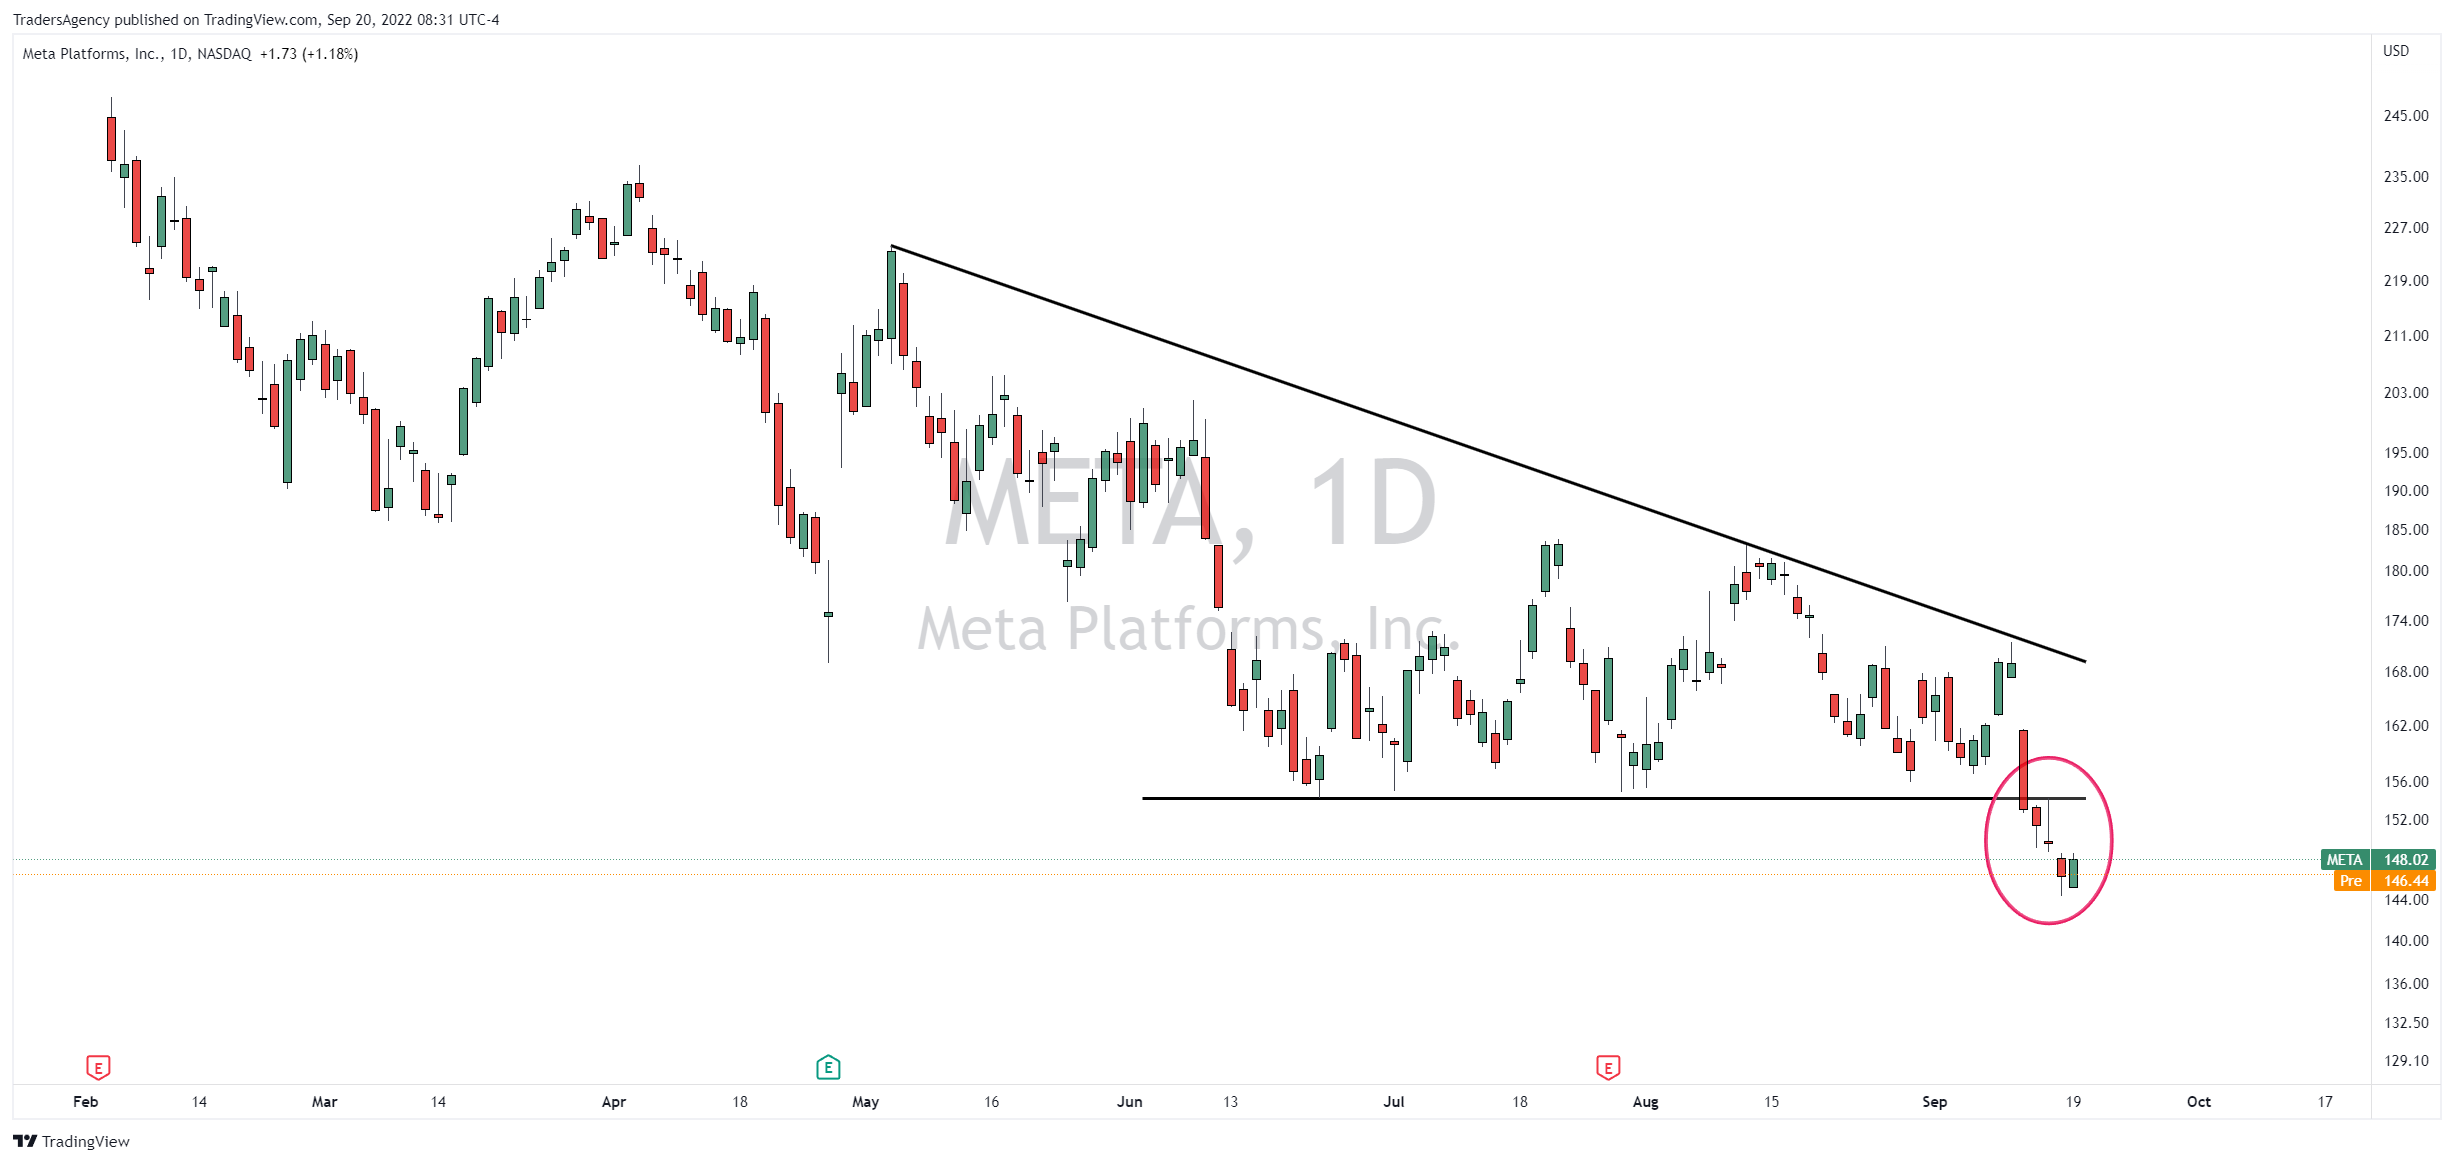
You can see on the daily chart that the stock created a descending upper boundary from May through September.
And from June through September, it looked like the stock was trying to stabilize as it created a horizontal lower support boundary.
These two factors are what make this a “descending” triangle pattern.
Breakdown
Well, although it looked like the stock was finding support, the descending upper boundary told a different tale.
When you see rallies getting shallower as price moves from left to right, it is a sign that more supply is coming to market.
And if more supply is coming to market, an decrease in demand is much more likely to trigger a substantial move lower in the price.
That’s exactly what’s happening here as investors continue to flee from the technology sector.
And although the stock is already down over 5% from the breakdown point, META’s next move lower may just be starting…
Join Today’s Live Session
Now, if you want to get my absolute best stock tips sent directly every time there’s a new opportunity, check out my premium Alpha Stocks trading service.
We have plenty of long ideas for the right stocks… We generated a gain of 21.3% in just 15 days in Permian Basin Royalty Trust (PBT) as that stock broke out of its range.
And last month, we closed another winner in Enphase Energy, Inc. (ENPH) for a quick gain of 22.5%.
But we’re also not afraid to go short… We even recorded a 21.6% gain on the downside in only eight days as Pegasystems Inc. (PEGA) stock plunged…
Of course, we also get together every Monday for an hour-long live session so that subscribers can ask questions and get guidance about our trades.
If you’re ready to see what you could be missing out on, I’m holding a special session this afternoon in which I’ll discuss my strategy in more detail…
Just click here to register and learn more about Alpha Stocks now!
Embrace the surge,

Ross Givens
Editor, Stock Surge Daily


