Hey, Ross here.
First things first: don’t panic.
If you watched the markets last week, you saw Silver, Gold, and Copper get absolutely whacked. Headlines screaming about a historic crash. Retail investors sprinting for the exits.
What I’m about to tell you might sound crazy.
Friday’s drop in metals prices wasn’t just normal. It was actually good for prices in the long term.
Most investors see a red chart and assume crisis. I look at the data and see a necessary cleansing. This event removed excess leverage from the system, clearing the deck for the upward trend to continue for years.
This wasn’t a fundamental crash. It was a structural reset—a perfect storm of excess leverage colliding with new margin requirements, triggering forced liquidations on a massive scale.
The carnage is over. The band-aid has been ripped off.
Level-headed investors who can tune out the noise are seeing this for what it is: a massive buying opportunity.
I’m going to break down exactly what happened Friday. I’ll show you the math behind the crash, why we’re highly unlikely to see this repeat anytime soon, and exactly where you should be looking to buy.
What comes next isn’t a bear market. It’s a resumption of the bull run.
The $7 Trillion Illusion
To understand why you shouldn’t be worried, we need to look at the data objectively.
Financial media headlines look terrifying right now. They’re screaming that Gold and Silver wiped out $7 trillion—calling it the “biggest liquidation event in world history.”
In dollar terms, that’s technically true. But ask yourself: what did we really wipe out?
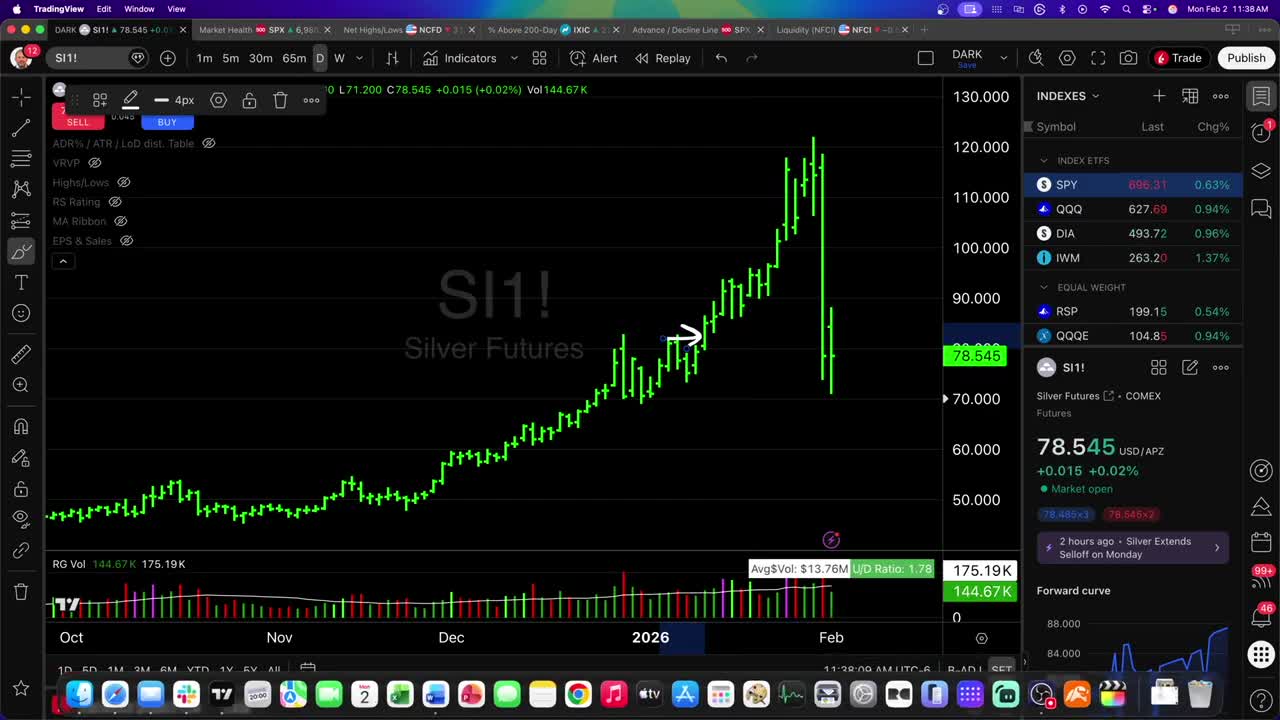
Look at the daily candlestick chart for Silver Futures. You see a parabolic rise followed by a sharp pullback. But look closely at the levels. Silver fell back to where it was trading just three weeks ago.
Sure, $7 trillion was “wiped out.” That same $7 trillion was created out of thin air over the previous three weeks.
The move went too far, too fast. Too much paper wealth was created too quickly, and the market required a reset to sustain the long-term trend.
This wasn’t a change in value. It was a change in price velocity.
How the “Paper” Market Works
To understand what triggered this sell-off, you need to understand the machinery of the futures market. This is where the big money plays—and it functions very differently from buying a coin at a dealer.
The multi-billion dollar Wall Street outfits aren’t buying physical metal. They aren’t showing up with a Mack truck, telling a dealer to “load it in the back,” then storing gold bars in a broom closet.
They’re buying paper contracts. They’re buying futures.
When you buy a futures contract, you’re buying the future delivery of a commodity. Buy a July silver contract, and you’re technically agreeing to have silver delivered to you in July.
Here’s the reality: almost nobody takes delivery.
These contracts were originally created for farmers. A farmer expecting to harvest 10,000 bushels of corn faces wild price fluctuations between planting and harvest. Futures let him pre-sell at a locked-in price. He gives up the upside if prices soar, but protects himself if they crash.
That was the intention. We—as American investors and speculators—have turned this into a massive money-making operation.
The Contract Specs
Let’s look at the actual math, because this is where the danger lies.
According to CME Group contract specifications, a single Silver Futures contract represents 5,000 troy ounces.
On Thursday, before the crash, silver was trading around $100 an ounce. Do the math:
Here’s the kicker: You don’t need $500,000 to control that contract. You only need to put up “initial margin.”
On Thursday, the initial margin to control that half-million-dollar position was only about $25,000.
Think about that. For $25,000 down, you control $500,000 worth of silver. That’s 20-to-1 leverage.
Gold is the same story. A gold contract is 100 troy ounces. At $5,000 an ounce, that’s a $500,000 position. The margin requirement? Just $24,000.
This leverage creates millionaires on the way up—and bankruptcies on the way down.
The Trap: Pyramiding Leverage
This is where greed kicks in.
Let me walk you through how a trader turns a small account into a massive fortune—and then loses it all in minutes.
Imagine a trader buys the breakout in silver at $55 an ounce. He buys one single contract.
- He puts up $25,000 in cash
- He now controls 5,000 ounces of silver
Silver moves from $55 to $70. That’s a $15 gain per ounce.
The Snowball Effect
Traders don’t cash out here. Their goal is to snowball these once-in-a-generation moves. They want to print money. So they use new profits to buy more contracts.
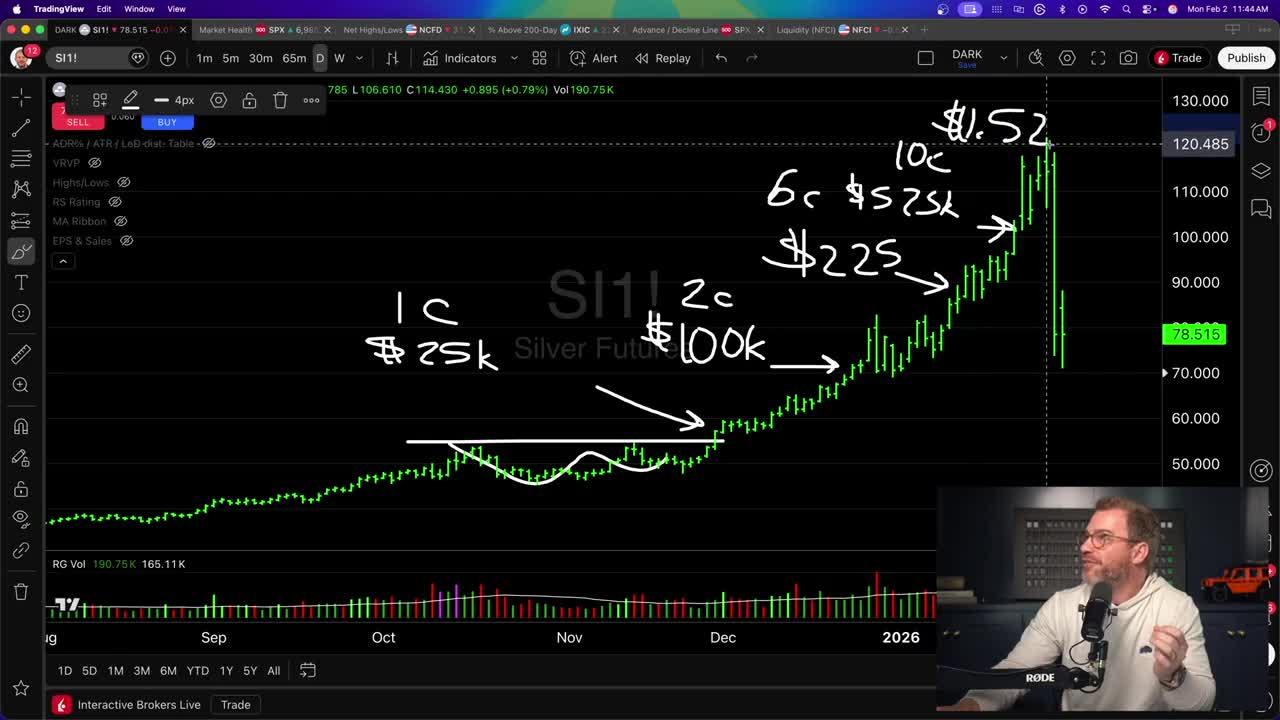
He buys another contract. Now he holds two. Silver goes from $70 to $85—another $15 gain on 10,000 ounces. That’s $150,000 in new profit. His account hits $225,000.
He presses his bet. Buys four more contracts. Now he holds six. Silver goes from $90 to $100. A $10 gain on 30,000 ounces equals $300,000 profit. His account crosses $525,000.
He buys four more. Now he holds 10 contracts controlling 50,000 ounces of silver. Silver runs from $100 to $120. A $20 gain on 50,000 ounces equals $1,000,000 profit.
This is how parabolic moves happen. Traders pyramid their leverage, buying more and more as price rises, riding the trend until the math becomes unsustainable.
The Trigger: Margin Rules Changed
When you have that much leverage in the system, the market becomes incredibly fragile. The CME saw this volatility spiraling out of control and stepped in.
They raised the margin requirements.
Historically, margin was a flat dollar amount—around $25,000 per contract. But with prices skyrocketing, the CME decided that wasn’t enough protection. They switched to a percentage-based margin of roughly 8% of contract value.
When silver is at $120, an 8% margin is significantly higher than the old flat fee. Suddenly, traders needed about 25% more cash just to hold positions they already had.
These new rules were set to go into effect at the close of business on Friday, January 30th.
Traders saw this coming Thursday. They knew they had to come up with millions in cash—or sell.
The Thursday Warning Shot
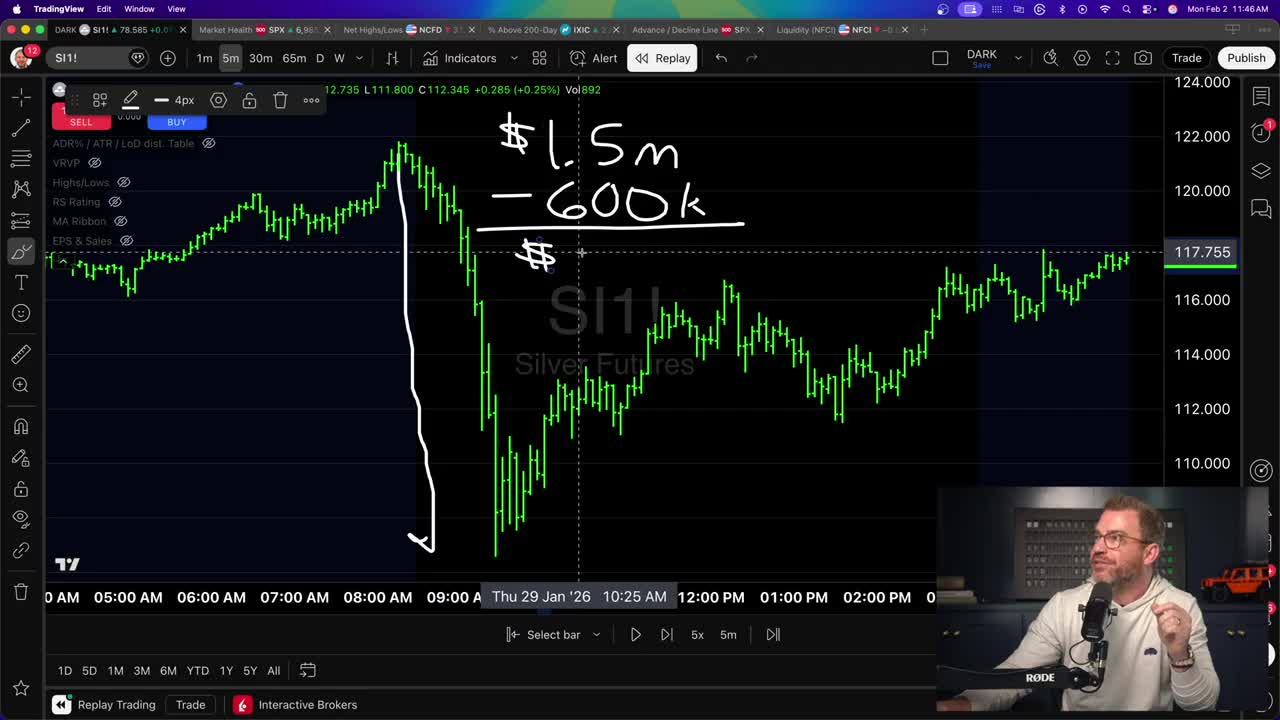
Look at the 5-minute chart for Silver Futures on Thursday. You can see the panic begin. Silver fell from $120 to $106 in a single hour.
Back to our trader with 10 contracts (50,000 ounces). A $14 drop times 50,000 ounces equals a $700,000 loss.
His account dropped from $1.5 million to $800,000 in 60 minutes.
That’s scary. But the real carnage was saved for Friday.
Become a member of my Black Ops Trading Club to get access to my live classes every Monday and Thursday.
Friday’s Bloodbath Explained
Friday morning, the market said, “Oh, you thought Thursday was bad? Hold my beer.”
As the deadline for new margin requirements approached, selling intensified. Traders began to liquidate. Not because they wanted to—because they had to.
Once price started dropping, it triggered stop-losses. This created a feedback loop of forced selling:
- Price drops → Margin calls triggered
- Traders can’t pay → Brokers force liquidate positions
- Selling pressure increases → Price drops further
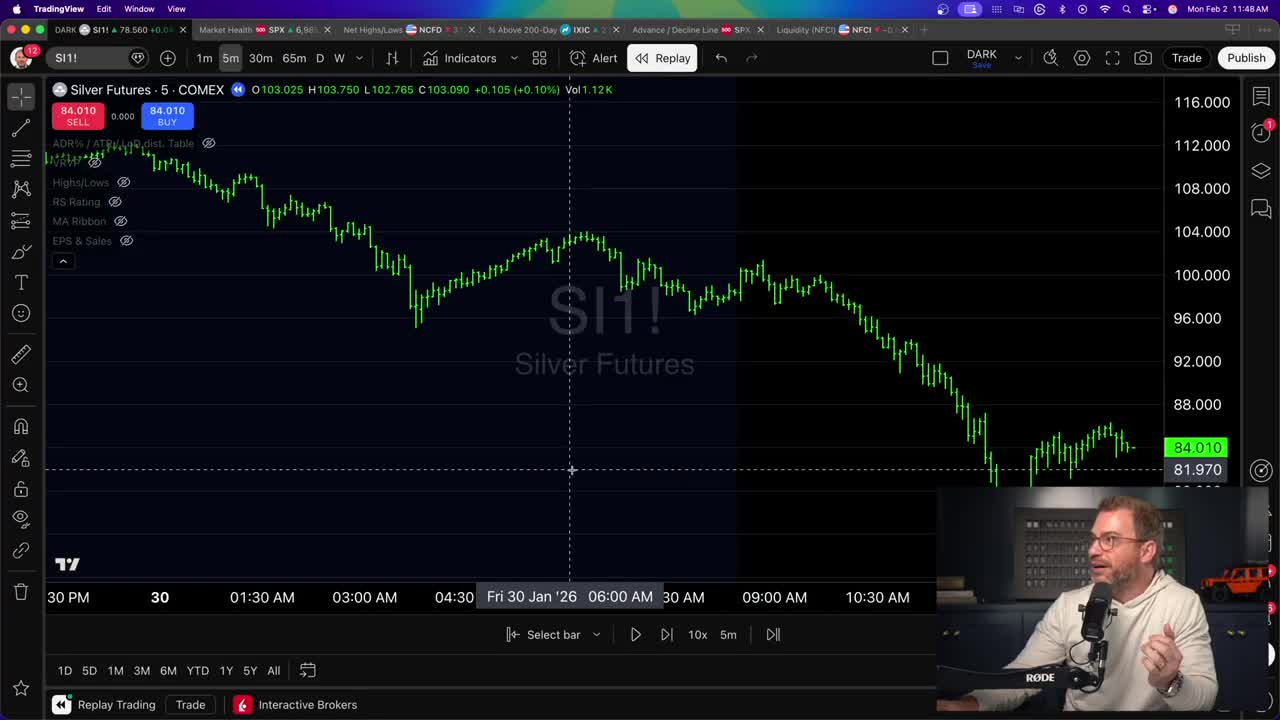
Look at the intraday chart for Friday. It looks like a straight line down. Silver collapsed all the way to around $75.
The Math of Ruin
Let’s look at our trader one last time. He was holding 10 contracts.
He started with $25,000. Built it to $1.5 million. On Friday, he didn’t just lose his profit—he went negative.
In reality, his broker would have force-liquidated him long before it hit bottom. He would have been wiped out somewhere in the middle of that drop.
This is why the market crashed.
It wasn’t because the world stopped needing silver. It wasn’t because inflation was solved. It was because Wall Street gamblers were levered to the hilt, and the exchange changed the rules, forcing them to sell everything at once.
If you were sitting on physical gold or silver in a safe, you were not force liquidated. You still have your ounces. The price on the screen changed, but your asset didn’t.
Why This Is Actually Bullish
Paradoxically, stocks and commodities cannot keep going up when there’s massive leverage in the system. When everyone is all-in on margin, the market is just waiting for the other shoe to drop.
We needed this flush.
The “weak hands”—the speculators, the leveraged futures traders—have been wiped out. The froth is gone.
Now we’re seeing some residual panic from the retail sector. Imagine the dinner table conversations over the weekend:
We’re seeing that emotional selling right now. But once it clears, look at the macro picture.
Nothing has changed.
Demand for silver in solar panels and electronics hasn’t fallen off a cliff. Central banks haven’t stopped buying gold. The government hasn’t stopped printing money. The national debt is still skyrocketing.
The fundamental drivers for metals are exactly the same as they were last week. We just got a parabolic blow-off top that reset price to a more sustainable level.
Where to Buy: The Technical Roadmap
The question now isn’t “should I sell?” It’s “where do I buy?”
I’m actively looking to add to my positions. Here are the specific levels I’m watching.
Gold: The Growth Channel
When analyzing gold’s long-term structure, I use a logarithmic scale chart. This smooths out parabolic moves and shows true percentage growth.
I draw a parallel channel starting from the initial breakout in March 2024. This channel frames the high and low of the trend. When price hits the top of the channel, it’s “overcooked.” When it hits the bottom, it’s a buy.
Friday’s crash simply took us from the top of the channel back to the middle. We wiped out the excess.
Silver: The Volatility Opportunity
Silver is trickier because it started its move later, really breaking out in mid-2025. But applying the same logarithmic channel logic, we can see where value lies.
Ideally, I want silver to consolidate. If price stays flat and moves sideways for a while, that’s fantastic. It allows moving averages to catch up and sets the stage for the next explosion higher.
Copper: The Supply Crunch
Copper is more volatile, but the crash here was actually quite mild. It fell about 7-8% and is currently holding around $5.83—right where we were a week ago.
My thesis on copper is simple: We do not have enough of it.
The mines are tapped out. Demand from data centers, AI, and grid expansion is exploding. I firmly believe copper is heading to $12 to $20 a pound over the next few years.
I like to buy copper on breakouts. I want to see price consolidate, absorb supply, tighten up against resistance, then break out. I’m holding my position and will add more once this consolidation pattern resolves.
Final Thoughts: The Wealth Transfer
If there’s one takeaway from this chaotic week, it’s this: Volatility punishes leverage, but it rewards patience.
The traders who got wiped out were trying to get rich in a week. They were gambling.
If you’re a long-term investor, you need to separate price action from value. The price of silver dropped because of margin calls in Chicago, not because the value of silver changed in the real world.
I have not sold any silver. I have not sold any gold or copper. I am actively looking to add more.
This is a methodical process. We’re riding a metals super-cycle that will last for years. Don’t let a few days of liquidation scare you out of the biggest trend of the decade.
Stay level-headed. Watch the levels I mentioned. And get ready to buy when the crowd is panic selling.
If you want a deeper analysis on where capital is rotating next — and how to position before the crowd — become a member of my Black Ops Trading Club. I provide updates like these every Monday and Thursday in my live classes.