
A week ago, we talked about the “head and shoulders” pattern.
This is a fairly popular trading pattern that is defined by a left shoulder, a head and a right shoulder, which are all tied together by the neckline.
We explained that the head and shoulders (H&S) can be either a continuation pattern or a reversal pattern depending on what happens at the neckline at the conclusion of the pattern.
But today, I want to talk about another aspect of the H&S pattern that we skipped over last week.
Turn It Upside Down
The inverted or inverse head and shoulders (H&S) pattern is a variation on the traditional H&S that is simply flipped upside down.
And just as the regular pattern than be a reversal pattern or a continuation pattern, so can the inverted version of the pattern.
Let’s take a look at a few quick examples…
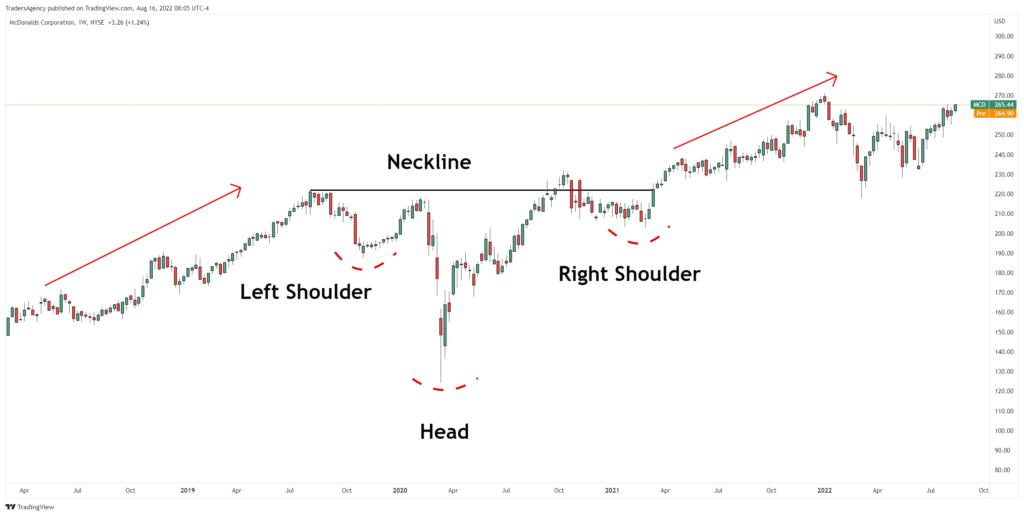
In the weekly chart of McDonald’s Corp. (MCD) above, you can see an example of an inverted H&S continuation pattern.
This is a continuation pattern because after completing the pattern by breaking the neckline to the upside, the stock continued moving in the direction it had been previously.
Go The Other Way
Now, here’s an example of an inverted H&S acting as a reversal pattern…
Just like a regular H&S can be a topping pattern, an inverted H&S can be a bottoming pattern.
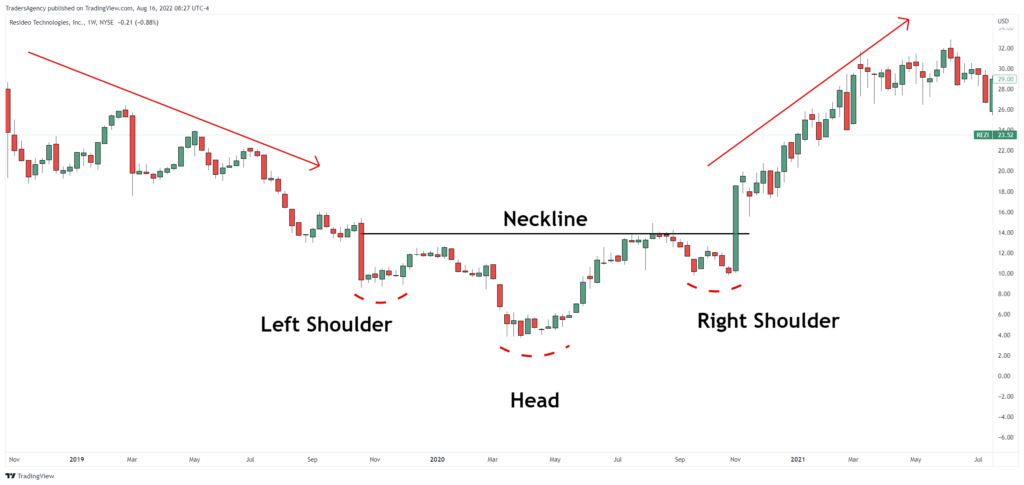
A great example of this can be seen in the weekly chart of Resideo Technologies, Inc. (REZI) above.
The stock was falling before the formation of the inverted H&S pattern, with the last two big drops forming the left shoulder and head of the pattern.
The first leg to the upside formed the right shoulder, and the stock took off once the neckline was broken to the upside.
So, this is also a reversal pattern because after completing the pattern by breaking the neckline to the upside, the stock then moved in the opposite direction it had been previously.
As you can see, the H&S pattern can show up in a variety of different ways. Be sure to familiarize yourself with this pattern so you can take action when you see the next one setting up…
Join Today’s Live Session
Now, if you want to get my absolute best stock tips sent directly every time there’s a new opportunity, check out my premium Alpha Stocks trading service.
We have plenty of long ideas for the right stocks… We recently generated a gain of 21.3% in just 15 days in Permian Basin Royalty Trust (PBT) as that stock broke out of its range.
And last week, we closed another winner in Enphase Energy, Inc. (ENPH) for a quick gain of 22.5%.
But we’re also not afraid to go short… We recently recorded a 21.6% gain on the downside in only eight days as Pegasystems Inc. (PEGA) stock plunged…
Of course, we also get together every Monday for an hour-long live session so that subscribers can ask questions and get guidance about our trades.
If you’re ready to see what you could be missing out on, I’m holding a special session this afternoon in which I’ll discuss my strategy in more detail…
Just click here to register and learn more about Alpha Stocks now!
Embrace the surge,

Ross Givens
Editor, Stock Surge Daily


