Hey, Ross here:
In yesterday’s newsletter, I broke down how the markets did in January…
And showed why – with data – we will likely be seeing a choppy month in February.
Specifically, I called out the outperformance of the “defensive” sectors – like Consumer Staples and Energy – compared to the “offensive” sectors like Tech.
Well, yesterday, Tech sold off again while Consumer Staples outperformed.
Again, this is generally NOT what we want to see for the broader market to perform.
But that doesn’t mean there aren’t any opportunities to target.
Take a look at the chart below.
Chart of the Day
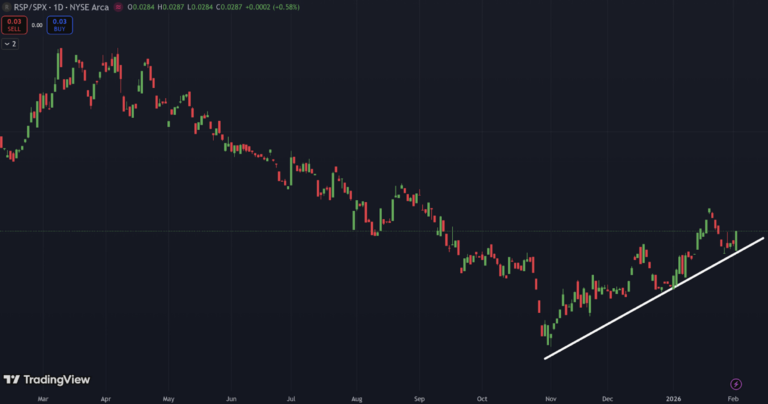
This chart is RSP/SPX – the ratio of the Equal Weight S&P 500 to the regular cap-weighted S&P 500.
The same 500 stocks – just a difference in how both are aggregated.
The higher the RSP/SPX ratio, the better the “average” S&P 500 stock is doing versus the mega-caps – and vice versa.
If you take a look at the chart…
You can see that from March to November 2025, the cap-weighted index has kept outperforming its equal-weight counterpart.
Since November 2025, however, that has shifted.
While there have been ups-and-downs – you can see that the RSP/SPX ratio has been in a distinct uptrend.
In short, there is plenty of opportunity in the lesser-known stocks right now.
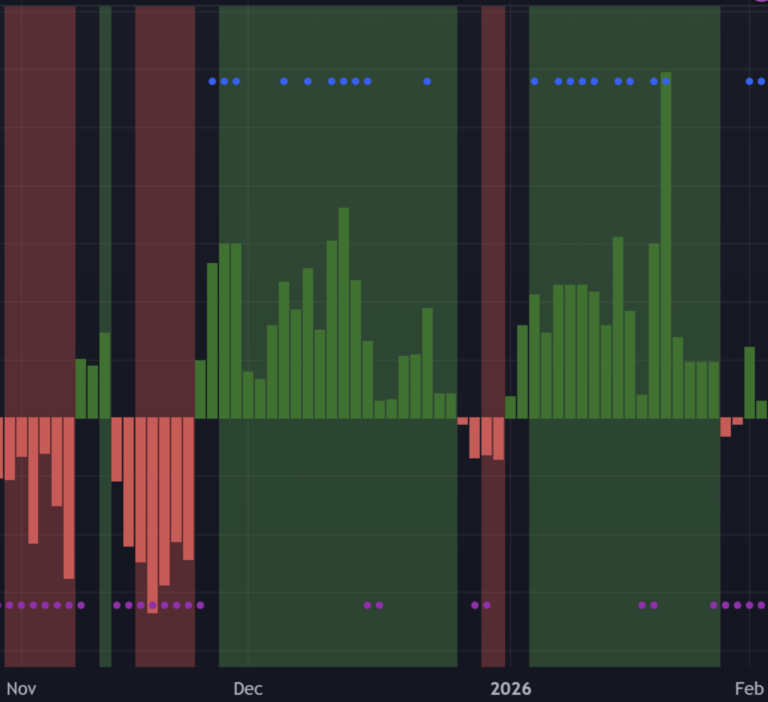
And we can see this in the Net New Highs/Lows chart below…
Which, despite yesterday’s dip – remains positive.
I dive deeper into the current playbook below.
Insight of the Day
The best way to filter for breakout opportunities right now is via price action.
Once we remove the popular mega-cap stocks that everyone and their neighbor has heard of…
We enter a universe where there are literally hundreds to thousands of stocks – many with barely any analyst coverage, let alone name recognition.
And as you’ve just seen…
This is where the opportunity is right now.
So how do you filter them down?
It would be impossible to do a detailed analysis on hundreds of these stocks.
That’s why the most effective way to filter for the most lucrative opportunities is to use price action.
And later this afternoon at 3 p.m. Eastern…
I’m going LIVE to reveal my #1 breakout pattern I’m using to laser in on the hottest opportunities right now…
As well as the next group of stocks this pattern is pointing to.
This breakout pattern has identified stocks that have exploded 270% in 70 days… 177% in 11 days… even 148% in just 2 days.
But with fear coming back into the market…
Now is the time to position yourself before the next wave of breakouts hit.
So click here to lock in your free seat if you haven’t already…
And I’ll see you later today at 3 p.m. ET.
P.S. If you’re planning to attend on a mobile device, make sure you download the presentation app now so you don’t miss anything when it starts. See you there.
iOS: https://apps.apple.com/us/app/goto/id1465614785
Android: https://play.google.com/store/search?q=goto&c=apps
Customer Story of the Day
“Traders Agency is a great company to be associated with.
Ross Givens does a fantastic job of explaining strategy in a way that’s thorough while also being easy to understand.
I’m very happy I got on board. Additionally, the customer service has also been prompt and fantastic!”
")
Ross Givens
Editor, Stock Surge Daily