
Walmart Inc. (Short)
First up is a bearish idea in Walmart Inc. (WMT), the massive $376 billion discount retailer.
Here’s how the chart is setting up…

And here’s how the stock is scoring on my Stock Surge Indicator (SSI):
- Surge score: 45/100
- % Above 52-wk low: 8%
- Sales growth: +4%
- Triple momentum: yes (short)
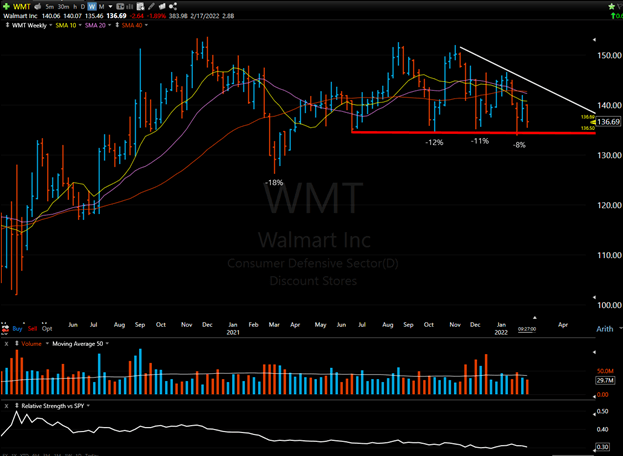
Despite success with its grocery pickup and delivery business, the stock looks very toppy.
As you can see in the weekly chart above, WMT has made a series of lower highs for the last six months.
The $134 level seems to be the line in the sand. If this level fails, look for a quick move to the downside.
I would consider shorting WMT either on a break below $134 or on a bounce up into the $140 range.
I would close the short trade if price breaks above the white downtrend line shown on the chart.
SilverBow Resources, Inc.
SilverBow Resources, Inc. (SBOW) is a $400 million oil exploration and production company.
I added SBOW to the Watchlist last week, but it has not yet broken out.
Here’s how the chart is setting up…
And here’s how the stock is setting up with my SSI:
- Surge score: 99/100
- % Above 52-wk low: 331%
- Sales growth: +117%
- Triple momentum: yes
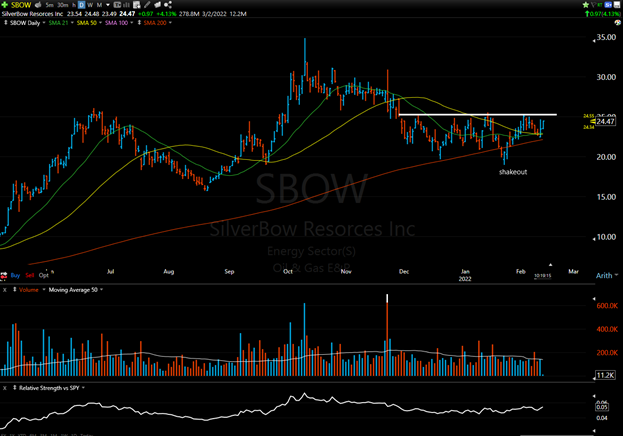
After a dip early in the week, shares snapped back Thursday and Friday, showing good “tennis ball action” strength.
Unfortunately, the low of the shakeout move in January is too far away to use for a stop.
Therefore, I suggest using an arbitrary stop loss of somewhere around 8%.
Look for a move above $25.55 as the entry trigger.
Signet Jewelers Limited
Signet Jewelers Limited (SIG) is a $4.4 billion luxury goods retailer with recognizable brands like Kay Jewelers and Zales Jewelers.
Here’s how the chart is setting up…

And here’s how the stock is setting up with my SSI:
- Surge score: 94/100
- % Above 52-wk low: 136%
- Sales growth: +18%
- Triple momentum: yes
SIG is an interesting setup in the consumer cyclical space.
This is one of the only areas where breakouts are getting traction (along with energy and a few regional banks).
Last week, the stock broke the downtrend line and found support against the 200-day moving average.
It is now tightening up sideways with resistance near the $88 area.
Look for a breakout above the green horizontal resistance line on the chart.
We need to see above-average volume for confirmation.
Lastly, if you’d like a step-by-step walkthrough on how to best take advantage of trades like these…
Be sure to check out my article, How to Follow My Weekly Trades, to know where I’m buying or shorting so that you can follow along.
The post Watchlist Week of Feb 14th, 2022 appeared first on Stock Surge Daily.
See more from Traders Agency on Google
Make us a preferred source and our market analysis will appear more prominently in your Google Search, Top Stories, and AI results.
Add to Preferred Sources