Good morning, Traders!
The E-mini Russell 2000 (RTY) is giving us a bit of a bearish push as the market retraces to a lower price. But since the long-term direction is up, we can expect the market to U-turn and head back up toward the 2325.0 price point for our Fibonacci extension. That means we’ll have an opportunity to buy the market when it’s on its way back up!
This is the sort of situation we like to look for. The market is dropping to a lower price, but the long-term direction is still positive. That’s because markets move in waves. We’ll see the market drop in price and surge to new highs within the up trend. And we buy those low prices along the way. That’s the strategy behind making money in the futures market.
Now let’s take a look at the RTY’s timeframe analysis and get ready to trade!
Daily Timeframe Analysis
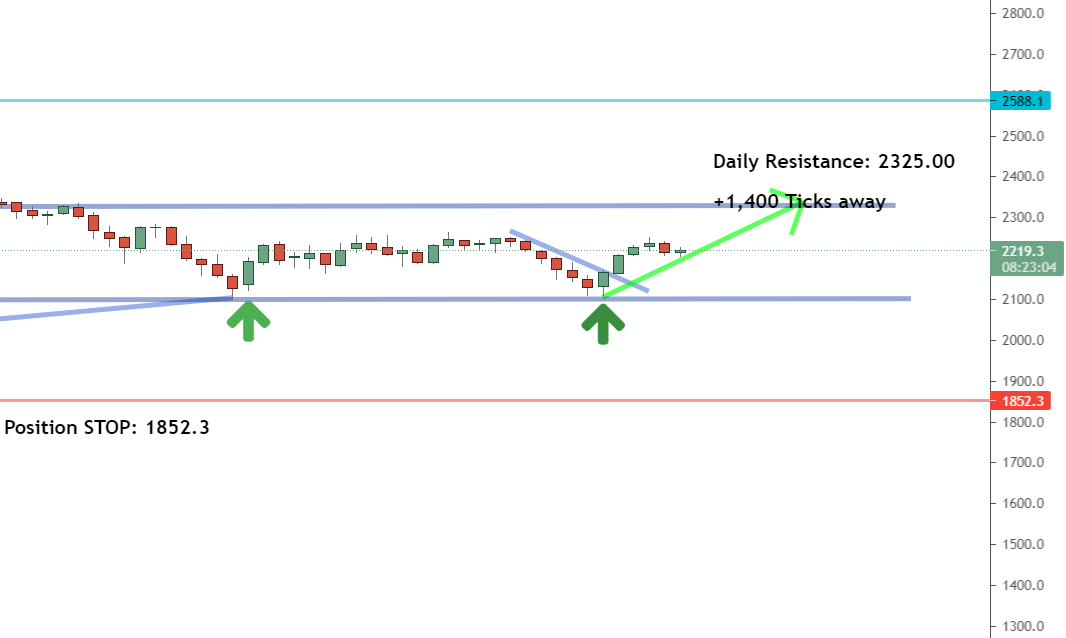
The RTY is mainly trading sideways in the daily timeframe, but with an overall upward direction for the long-term. The market broke a counter trendline after hitting the bottom of the channel, giving us a strong indication that the market is preparing for a bullish push after the price recovers.DAILY TIMEFRAME

The long-term direction is up for the RTY

The short-term direction of the RTY is currently down

We’re waiting for the RTY to turn back positive in the short-term
Learn more about the Daily Direction Indicators here…

The long-term direction for the RTY is up as the market could be setting up for a bullish push
I know it can be a bit difficult to understand how the long-term and short-term analyses of a market work together in our overall strategy. So be sure to check out my video that discusses the key differences.
| Recommended Link:Josh Martinez has become an expert at identifying financial patterns that tend to repeat themselves consistently time and time again. And just as his track record shows, he’s identified a new “Millionaire’s Pattern” emerging right now. The last time an anomaly this BIG was spotted in the financial markets, he was able to shape an initial deposit investment of $500 into $39,282! Based on our research, we are at the starting point of the “Next Big Thing”. Only this time, we’re talking about a far BIGGER,$500-into-$50,000 opportunity… Use this special link to explore Josh’s #1 investment opportunity for 2021 |
One-Hour Timeframe Analysis
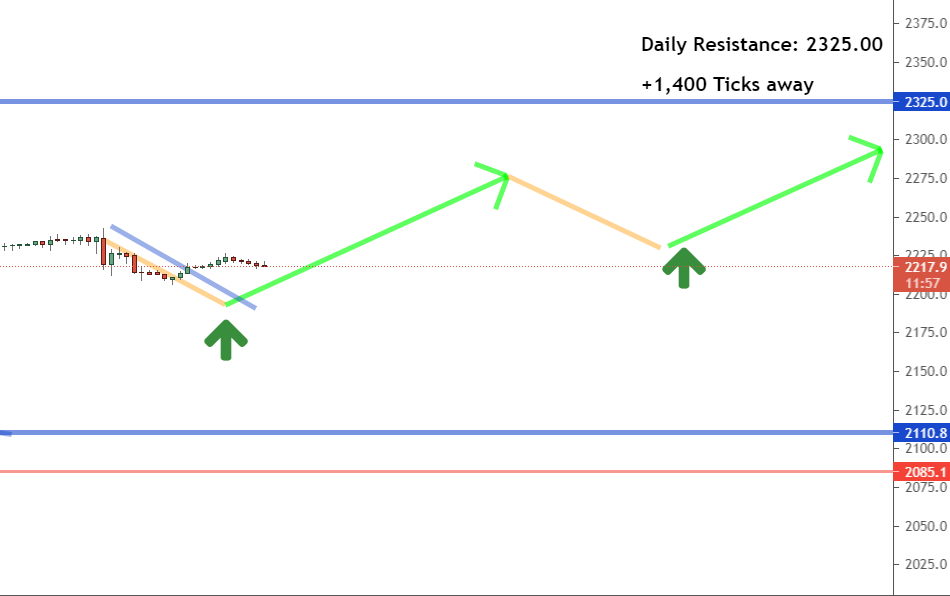
As we turn to the one-hour timeframe, we’ll see that the RTY is giving us a retracement (temporary price drop) within the chart. Remember that this can be a good thing when the long-term direction is up. As the price recovers, we’ll have an opportunity to buy at a low price as the RTY heads to the 2325.0 price point

The RTY is giving us a nice retracement that we can take advantage of when the price begins to recover
The current RTY setup is an example of why it’s important not to let price dips make you nervous. So long as our overall long-term direction remains positive for the market, a retracement can put us in a position to buy at low prices before another bullish push. After all, that’s how we make money in trading!The Bottom Line
Though the short-term direction is down for the RTY, the long-term is still positive. That means we’ll want to watch our timeframe charts and keep an eye out for a turnaround in the RTY’s short-term direction.
When that happens, we’ll prepare our entry strategy and look for buying opportunities as the RTY sets up for another bullish push. We can expect the RTY to make movements toward a 2325.0 on its journey back to positive territory within the short-term.

The RTY is setting up to give us good buying opportunities as the short-term direction prepares to turn positive again
You now have all of the knowledge you need to trade the RTY, but where do you start? Don’t worry. I’ll teach you how to get going! Follow along as I explain the key components of my trading strategy that can help you become a successful futures trader!
Keep On Trading,

Mindset Advantage: Greed
It’s never what you make that counts: it’s what you get to keep.
We hear the same story time and time again: the money gets made, the profits are amazing… and then it’s all given back to the harsh maiden of the market.
It’s not because the money isn’t there to be made. It’s often due to good old fashioned greed. Stops get pushed back. Targets get forgotten. That trade made $100… why not turn it into $500 or $1,000?
These are the traps that snare 95% of the profit. Take what the market gives you and go about your business. ‘Honor thy stop’ and your risk reward ratio. Don’t take that trade if you don’t feel good about it.
The ones you don’t take, or the ones that you end up stepping out of… those are the ones that keep you on the path to consistent profits!
Traders Training Session

Trading Longer Time Frames vs Shorter Time Frames Tutorial
The post Why lower prices are so helpful appeared first on Josh Daily Direction.


