Good morning, Traders!
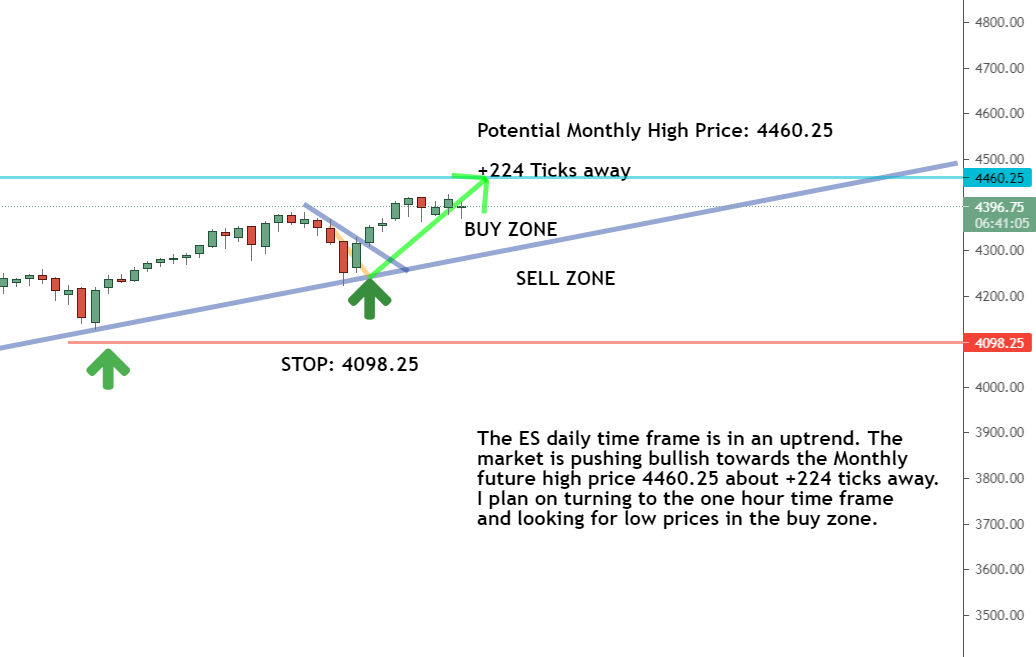
The S&P 500 E-mini futures market (ES) is in an overall positive trend for both the long-term and short-term. We’re looking for the market to go to 4460.25 as it continues to rise.
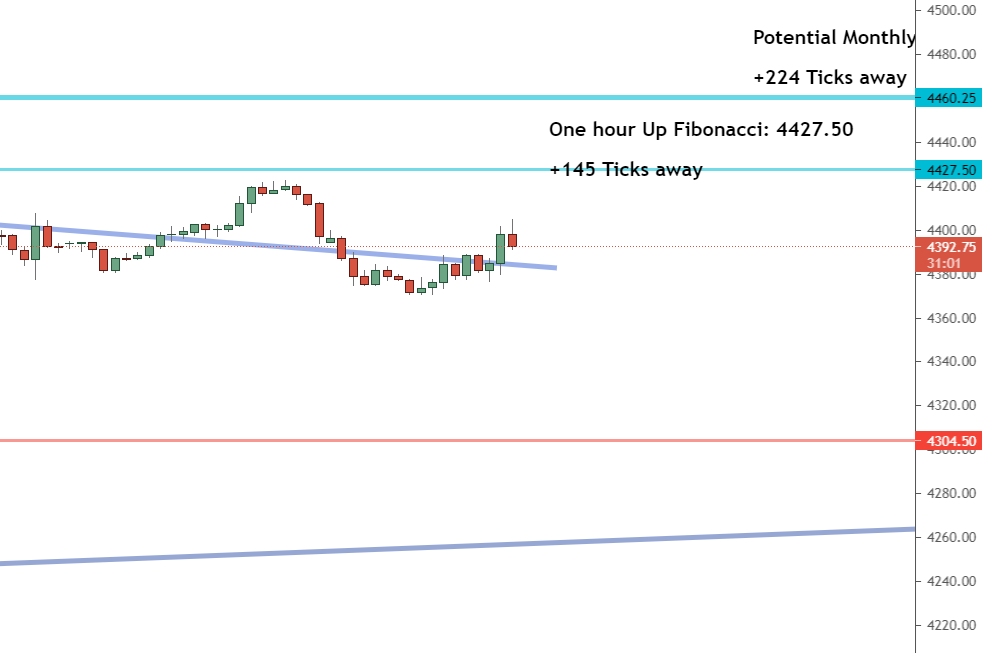
If you follow my strategy on utilizing counter trendlines, you’re doing pretty well with the ES right now! The counter trendline break is what gave us the current bullish push toward the Fibonacci extension.
And to help you better understand why trendlines are so important, check out this video I made that goes into more detail.
Our timeframe analysis for the RS shows that the market is getting close to our first limit within the one-hour timeframe. We’ll keep an eye on the market as it continues to move so we can be prepared to make the right decisions when it comes to the ES.
If you’re ready to jump in, read the full timeframe analysis below to see how the ES is moving right now:
Daily Timeframe Analysis
The ES daily timeframe is in an overall upward trend as it gets closer to the monthly future high price of 4460.26. We’re about +220 ticks away from that price point!
The ES continues to push bullish as the market climbs higher and higher. That means we want to switch to our one-hour timeframe and look for opportunities to buy the ES if/when we spot low prices along the way to the future high price.DAILY TIMEFRAME

The daily timeframe shows that the ES is moving upward

The ES one-hour timeframe now shows positive movement

The ES has bounced off support and has pushed through the counter trendline
Learn more about the Daily Direction Indicators here…

The ES is in a bullish push to the monthly high price of 4460.25
Understanding market trading patterns is crucial to following trades in markets like the ES. Check out my free resource on the subject before you jump in and start trying to trade.
You’ll need all the information you can get if you want to become a successful futures trader!
| Recommended Link:Josh Martinez has become an expert at identifying financial patterns that tend to repeat themselves consistently time and time again. And just as his track record shows, he’s identified a new “Millionaire’s Pattern” emerging right now. The last time an anomaly this BIG was spotted in the financial markets, he was able to shape an initial deposit investment of $500 into $39,282! Based on our research, we are at the starting point of the “Next Big Thing”. Only this time, we’re talking about a far BIGGER,$500-into-$50,000 opportunity… Use this special link to explore Josh’s #1 investment opportunity for 2021 |
One-Hour Timeframe Analysis
What’s great about the ES one-hour timeframe is that it shows how well our counter trendline strategy works. As you can see in the below chart, the counter trendline break is what gave us the current rally in the ES market (diagonal grey line).

The counter trendline break in the one-hour timeframe is what gave us this current extension in the ES
Remember that the one-hour timeframe helps us determine when and how to execute our buy-in strategy for the market. We buy low in the buy zone and watch as the market hits a new high price. Take advantage of my free resources to better understand how all of this works!
The Bottom Line
The directions for both the long-term and short-term are up for the ES market. The ES broke the counter trendline and is heading for a new high price.
This is a good example of how my trendline process reveals opportunities in the market that will help you grow your trading account. But it only works if you use it!

The directions for both the long-term and short-term are up for the ES market
Are you prepared to take advantage of the current trading situation now that you have a better understanding of the ES? Check out my resources to learn how to become a real futures trader who profits from the market. If you follow my method, you’ll see that it’s not as difficult as you may think!
Keep On Trading,

Mindset Advantage: Breathe
If you’re not breathing, you’re not focused. If you’re not focused, you can’t see the market. Opportunities slide by in an instant. Hazards reveal themselves only when it’s too late.
You need to breathe. Breathing exercises have proven to reduce stress and increase focus.
Sure, you’re already breathing if you read this. But when you trade… you need a breathing regimen. Whatever it is: Through your nose, out your mouth counting to 10 or 100. Find a method and routine that works for you.
You’ll find balance, clarity and focus when you trade. Your heart rate will come down and you’ll just feel better.
Try it. And enjoy your trading.Traders Training Session
This is why the Nasdaq is so popular
The post Are you utilizing trendlines correctly? appeared first on Josh Daily Direction.


4 Comments
July 31, 2021 @ 9:45 am
I love bitcoin
August 1, 2021 @ 12:18 am
You are mistaken. I can prove it.
August 12, 2021 @ 1:14 am
What trading platform is used? TD Ameritrade, ETrade or Fidelity would be helpful. Adding another and funding it would be a challenge.
August 12, 2021 @ 8:50 pm
Hi Daniel. We use TradingView for our charting. The broker which you use to place your trade is completely personal preference. We recommend trying demo accounts to test drive them to find what you are most comfortable with. I hope this helps!