Two months ago, I made a specific call on Bitcoin that many people didn’t want to hear.
At the time, Bitcoin was trading over $100,000. The consensus was overwhelmingly bullish. But looking at the data, I outlined exactly why the price was destined to fall to $60,000.
Not everyone agreed with my analysis. But here we are.
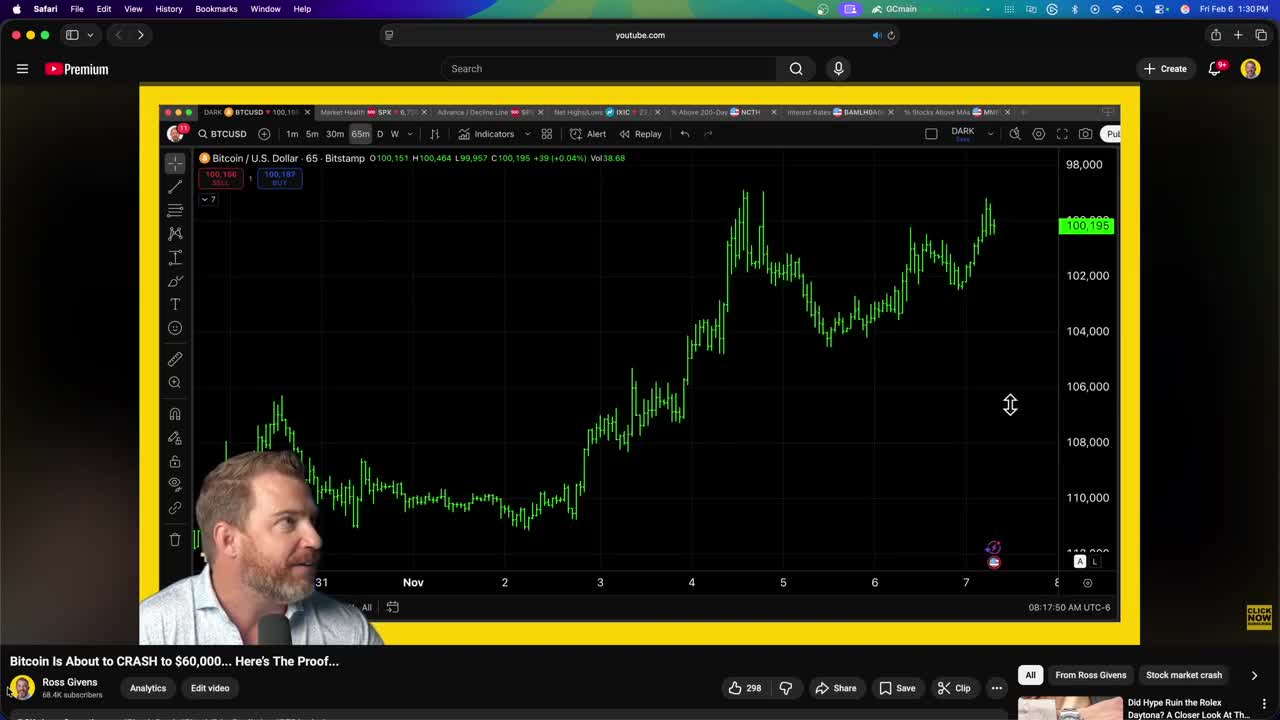
Last week, Bitcoin hit that $60,000 target.
It’s rebounding fast, and while it’s technically possible for the price to go straight up from here, I wouldn’t count on it. If you’ve been waiting for a good time to buy, this is that time—but you need to understand the specific price structure forming right now.
We’re likely going to see a setup I call a shallowing base pattern. This isn’t speculation. It’s a fundamental market mechanic driven by supply and demand, and it’s the same dynamic that governs commodities like gold and silver.
The Shallowing Base Pattern
What we’re looking for over the next few weeks is a very specific type of consolidation.
Typically, you get a resistance area near the highs. Below that resistance, you see price action characterized by deep dips that gradually “shallow out.” The price tightens and consolidates from left to right.

This tightening action is the precursor to a big final breakout higher.
Why does this happen? It isn’t witchcraft. It isn’t voodoo. It isn’t some esoteric formula like Fibonacci. It’s the visual representation of basic supply and demand.
People forget that markets are auctions. They’re just buyers and sellers trying to decide what something is worth. When those two parties agree, a trade takes place. But when supply outstrips demand—when there are more people trying to sell than buy—prices go down.
This pattern represents the absorption of that supply.
The Car Dealership Analogy
To understand why Bitcoin moves the way it does, stop thinking about “crypto” and start thinking about inventory.
Pretend you own a Toyota dealership. You’ve got 50 Camrys for sale on your lot right now, but they aren’t selling. You move a couple here and there, but the supply (how many cars you have) is greater than the demand (how many people are willing to buy them).
If you want to move those cars, you have only one option: You lower the price.
In fact, you keep lowering the price until demand increases and people are willing to buy them. That’s exactly how the stock market works.
Now consider the inverse. What would make you raise the price of your cars? What would make them go up in value? There are only two drivers:
- Increased Demand
- Decreased Supply
When Smokey and the Bandit hit theaters in 1977, demand for the Pontiac Trans Am skyrocketed. That’s a demand-driven price increase. But I don’t see Burt Reynolds bootlegging Coors in a Toyota Camry anytime soon.
So the other option is a supply shock. What if supply were to shrink? What if suddenly there weren’t very many Camrys available?
We actually saw this in 2021 after COVID. Plant shutdowns meant millions of new cars could not be built. The demand was the same, but supply was lower. Prices soared as a result.
Bitcoin’s Float is Shrinking
This dynamic applies directly to Bitcoin right now.
For the last several months, supply has exceeded demand for these coins. Before prices can go back up, that dynamic has to reverse. The supply has to be absorbed. Everyone who wants to sell needs to do so.
Here’s the critical factor: Not every coin is for sale.
At any given time, only a small percentage of the total supply is actually being offered for sale. This is known as the float. The bigger the float, the harder it is to move the price up.
When price consolidates—like the shallowing base pattern we’re looking for—that float shrinks. The supply of coins available for sale gets smaller.
Retail and institutional investors who have been building long-term positions at low prices are steadily buying this stuff up. They’re sucking the supply out of the market. They’re shrinking the float.
When the supply goes down, that same amount of demand—the exact same level of buying—can send the price higher. They’re chasing a smaller pool of available assets.
How to Identify the Setup
I get asked how to scan for these setups all the time. You’re looking for technical patterns that mirror this tightening behavior.
In technical charting terms, you’re looking for a Bullish Continuation Triangle.
While no pattern is a perfect match every time, this structure represents the same psychological behavior: the market is coiling.
If you’re scanning for these, you might see stocks like XLB. It recently showed a pretty clean pattern and is breaking out now.
A word of caution: Do not just buy a pattern because it looks nice on a chart. You must focus on leading stocks in leading groups.
All things being equal, no matter how clean the setup is, you’ll have a better chance of getting the results you want if you focus on the areas of the market that are rising the fastest. That’s where the money is flowing. That’s where the odds are tipped in your favor.
When the Pattern Works in Reverse
The same price action that tells us when something is about to go up can also warn you when it’s about to go down.
This is the exact logic I used to predict the Bitcoin crash back in December.
At that time, Bitcoin wasn’t consolidating. It was breaking down. The price action wasn’t tightening; it was widening. That’s a clear signal of distribution. Wall Street was dumping it.
If you flipped that chart upside down, it would have looked like a textbook breakout trade—exactly what we want to see for a move higher. But since it was happening to the downside, the reality was bearish.
I warned then that Bitcoin would come down to test the April lows at about 78,000. That was the next place it might find people interested in buying. I also stated that if 78,000 didn’t hold, it was going straight to 60,000.
That’s exactly what happened.
The MicroStrategy Reality Check
If you own Bitcoin and you’re currently sitting on a loss, take some comfort in the fact that this could very well be the low of the sell-off.
Plus, at least you’re doing better than Michael Saylor.
I’m scared to see the number for Q1, assuming he doesn’t declare bankruptcy first.
The Opportunity at Hand
We’ve hit the downside target. The 60,000 level was the objective, and the market has respected it.
Now, we watch for the tightening. We watch for the dips to get shallower. We watch for the float to shrink as the “weak hands” leave the market and the long-term accumulators step in.
This isn’t about guessing. It’s about recognizing the behavior of a market that is transitioning from distribution back to accumulation.
Get an entire year of live weekly mentoring sessions, my newsletter, indicators, bonus reports, tons more. Click the link and I’ll see you in the next live session.
DISCLAIMER: Traders Agency does not offer financial advice. The information provided is for educational purposes only and should not be considered financial advice. Traders Agency is not responsible for any financial losses or consequences resulting from the use of the information provided. Trading carries inherent risks and may not be suitable for all individuals. You are advised to conduct your own research and seek personalized advice before making any investment decisions, recognizing the potential risks and rewards involved.