
If you've ever risked the same 100 shares on a quiet utility stock and a wild biotech stock, you already know how that story ends. One trade barely moves the needle, and the other wipes out a week of gains. The fix isn't picking better stocks, it's sizing every trade to match how much that specific stock actually moves. That's what ATR position sizing does, and by the end of this guide, you'll know how to calculate Average True Range (ATR), set stops with it, and size every position so your risk stays consistent no matter what you're trading.
What Is ATR and How Does It Measure Volatility?
Bottom Line: ATR position sizing matches trade size and stop distance to each stock's actual volatility, so a quiet utility and a wild biotech can carry the same dollar risk instead of wildly different ones. The payoff is consistency: risk per trade stays steady, but ATR still needs to be paired with a direction-finding indicator since it only measures movement size, not where price is headed.
Average True Range (ATR) is an indicator that measures the average size of a stock's price movement over a set period, usually 14 days. It was originally built for commodities trading and is now a standard tool across stocks, forex, and crypto charting platforms.
ATR doesn't tell you direction. It only tells you how much a stock tends to move, in dollars (or pips, for forex). A stock with an ATR of $1.20 typically swings about $1.20 per day. A stock with an ATR of $5.00 is far more volatile and needs a wider stop and a smaller position to match.
Here's the math behind it. ATR is built from the True Range (TR), which is the greatest of three values:
- Current high minus current low
- The absolute value of current high minus previous close
- The absolute value of current low minus previous close
The 14-period ATR then averages those True Range values across 14 candles, using Wilder's smoothing rather than a plain simple average. As volatility rises, ATR rises. As it cools off, ATR falls back down.
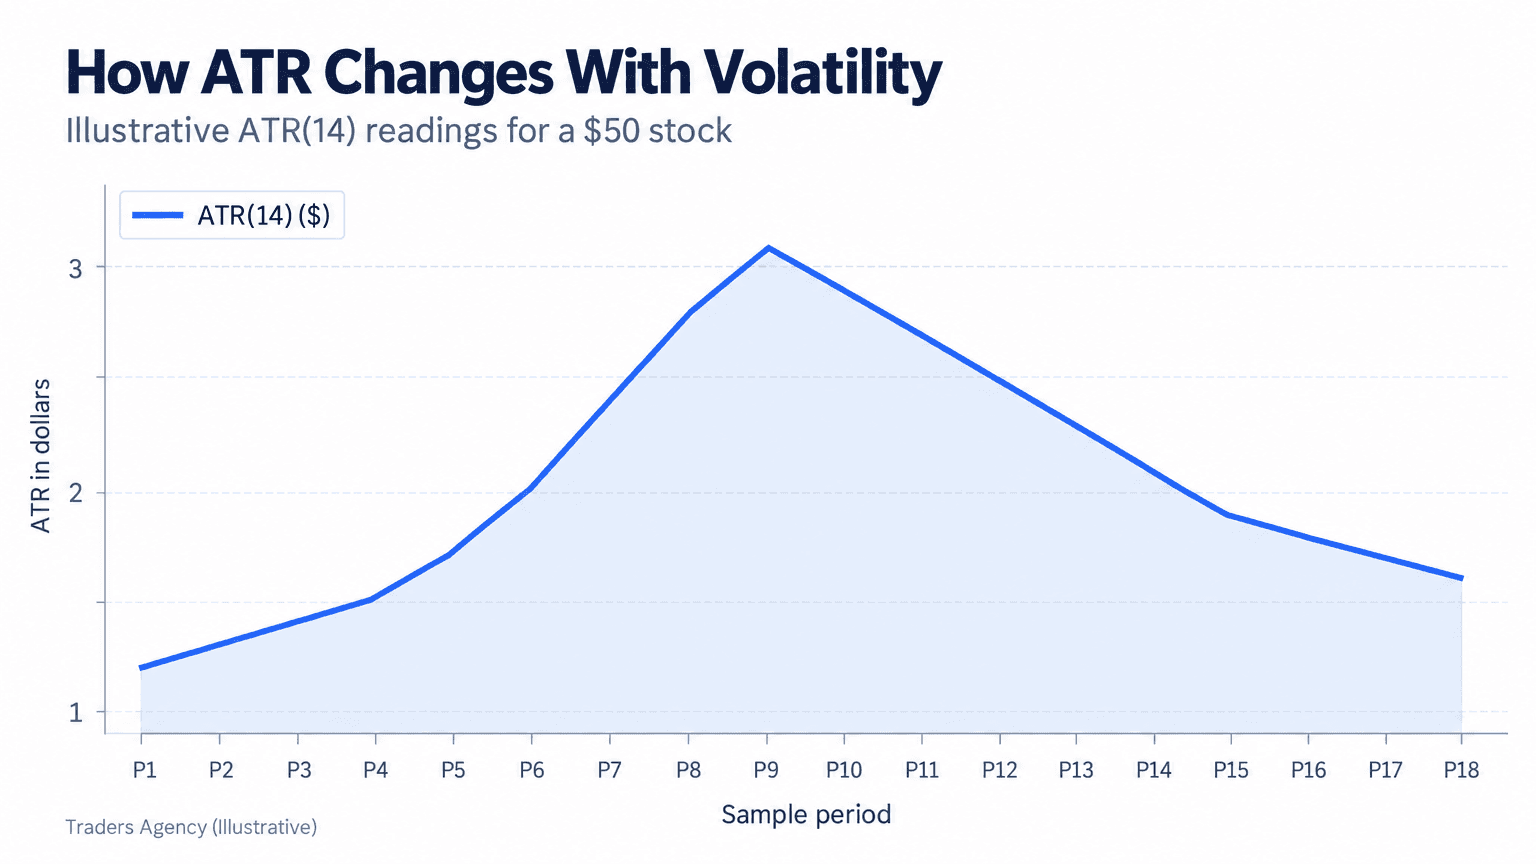
Notice how the ATR line climbs sharply during a volatility spike, then drifts back down as the market settles. That rise and fall is the entire reason ATR matters for sizing. A stop or position size that made sense last month might be wrong today if ATR has doubled.
What is the ATR position sizing formula?
The formula for position sizing with ATR is simple: divide how much you're willing to risk on a trade by the distance, in dollars, between your entry and your ATR-based stop.
Key Concept: Position Size = Risk Per Trade / (Entry Price - ATR Stop Price). The wider your stop (because ATR is high), the fewer shares you can hold while keeping your dollar risk the same.
This single formula is the backbone of most ATR position sizing strategy approaches, whether you trade stocks, options, or forex pairs. The logic is straightforward: as volatility expands, your size contracts, which keeps your risk per trade fixed no matter what you're trading.
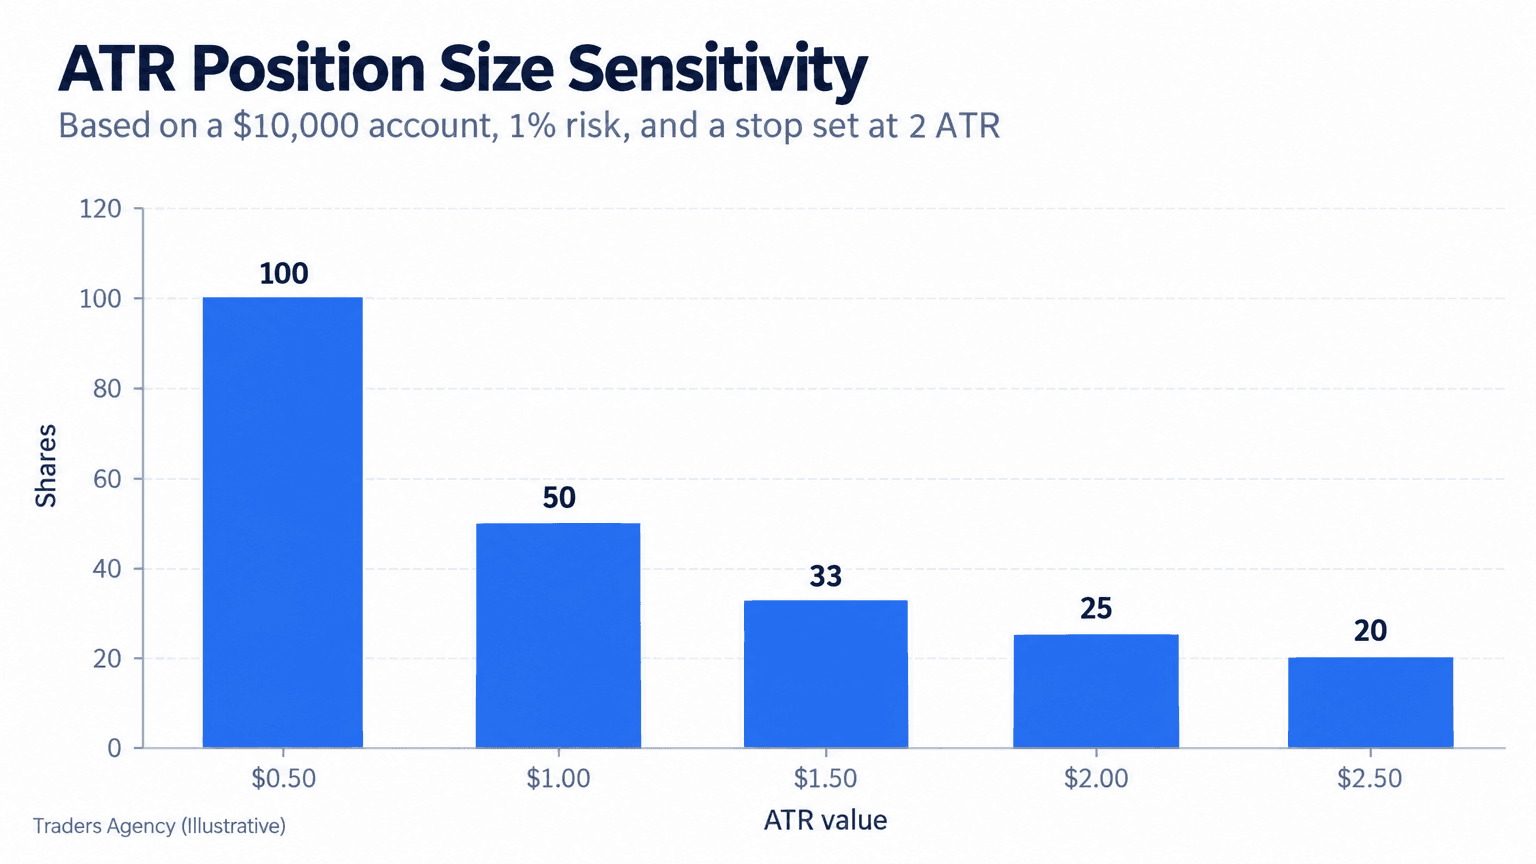
As you can see in the chart above, as ATR climbs from $0.50 to $2.50, the position size needed to hold risk constant drops from 100 shares down to around 20. That's the whole point: your dollar risk per trade stays fixed, even though the stock's behavior changes.
How do you set stop-losses using ATR multiples?
We typically set stops at 1.5 to 2 times the ATR below entry price for a long position, or above entry for a short position. This gives the trade enough room to breathe through normal daily noise without getting stopped out by a random wiggle.
Here's why a multiple matters instead of just using raw ATR: a single ATR unit often isn't wide enough to survive a normal pullback, especially in a trending stock. Multiplying by 1.5 or 2 accounts for the fact that price can occasionally swing beyond its typical daily range without actually reversing trend.
A Few Common Multiples We Use
- 1.5x ATR: Tighter stop, good for shorter holding periods or lower-volatility setups
- 2x ATR: Our default for swing trades held several days to a few weeks
- 3x ATR: Wider stop for longer-term trend trades where you want to avoid getting shaken out early
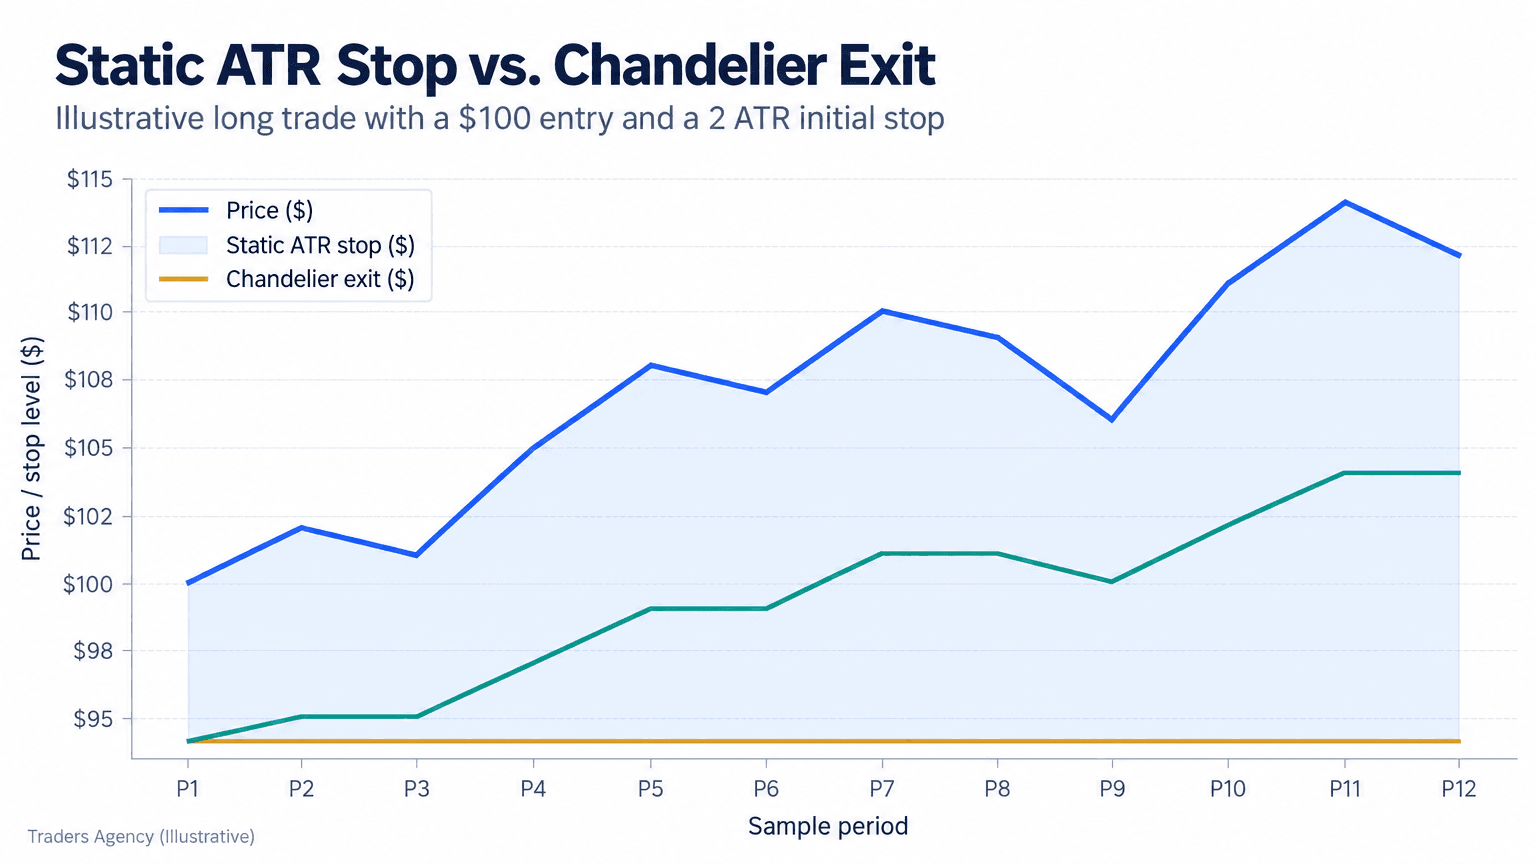
Notice that the fixed ATR stop stays flat while the price rises. That's a limitation we'll solve a bit later with chandelier exits.
What Is the Best ATR Period to Use?
We recommend a 14-period ATR for most swing and position traders, since it balances responsiveness with stability. Shorter periods like 5 react faster to sudden volatility but produce more noise, while longer periods like 20 smooth things out but lag behind real changes.
For day traders working on short timeframes, a shorter ATR period (often 5 to 10) can feel more useful because it reflects what's happening right now rather than two weeks ago. Swing traders and longer-term position traders generally stick with the standard 14-period setting because it's well tested and widely used across most charting platforms.
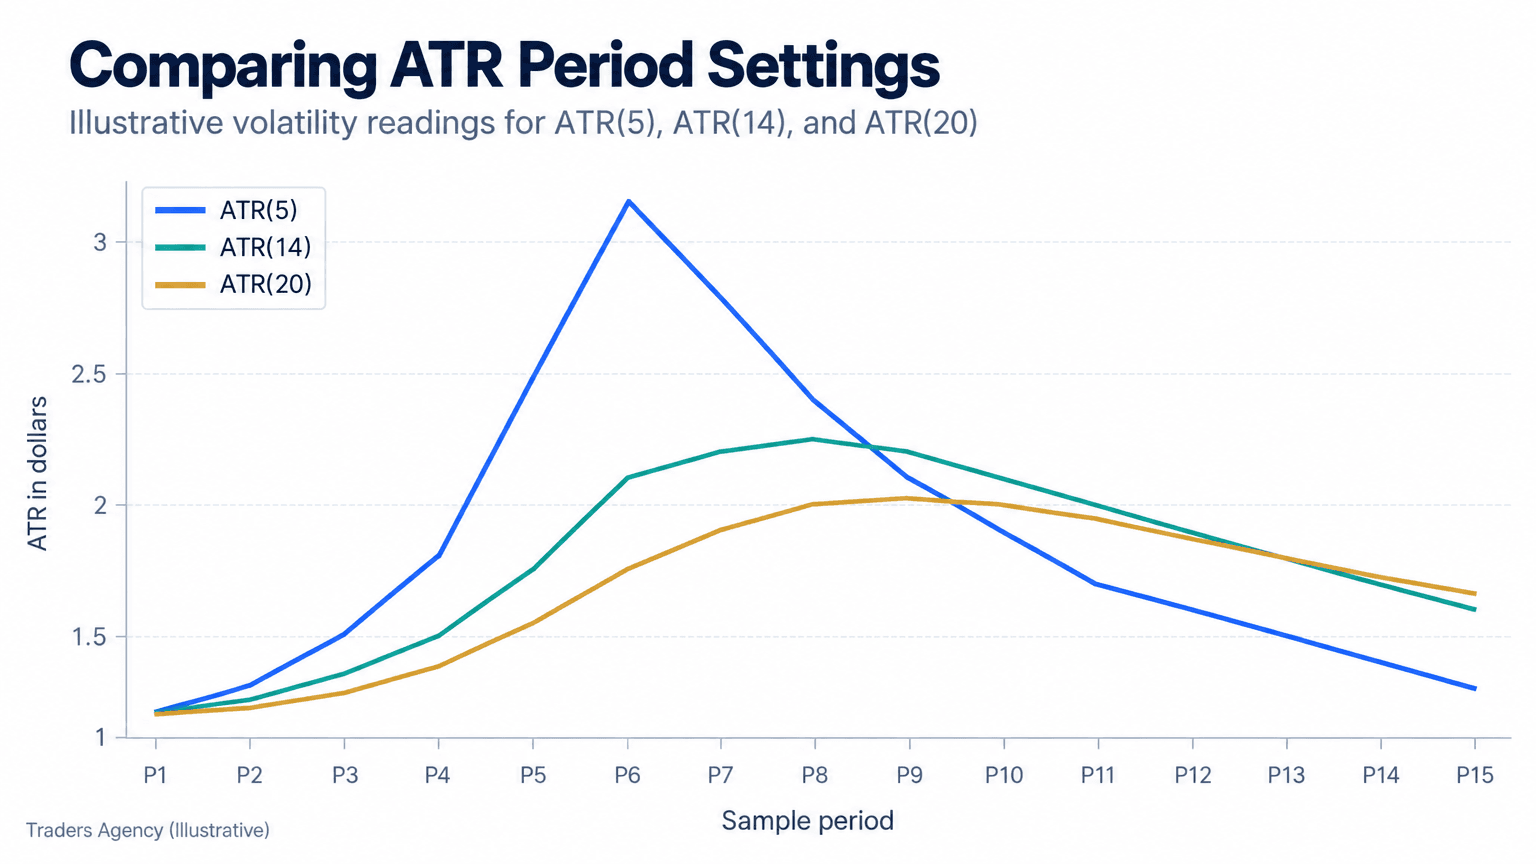
As shown above, the 5-period ATR spikes hardest when volatility jumps, while the 20-period barely moves. There's no single correct answer here. It depends on your timeframe and how quickly you want your sizing to adapt to changing conditions.
Want expert trading insights delivered daily?
Join thousands of traders who rely on Traders Agency for market analysis and trade ideas.
Join Traders AgencyHow do you calculate position size with ATR?
Let's walk through a full ATR position sizing example using real numbers.
Say you have a $10,000 account and you've decided to risk 1% per trade, which is $100. You're looking at a stock trading at $50 with a 14-period ATR of $2.00.
Step-By-Step Calculation
- Step 1: Set your stop distance. Using a 2x ATR multiple, your stop distance is $2.00 x 2 = $4.00
- Step 2: Set your stop price. $50 entry minus $4.00 stop distance = $46.00 stop-loss
- Step 3: Calculate position size. $100 risk / $4.00 stop distance = 25 shares
- Step 4: Confirm total exposure. 25 shares x $50 = $1,250 position size, well within account limits
| Scenario | Price | Profit/Loss |
|---|---|---|
| Stop Hit | $46.00 | -$100 (1% of account) |
| Scratch / Chop | Around $50 | Small loss or breakeven |
| Target Reached | $58.00 | +$200 (2:1 reward-to-risk) |
If the stock drops to $46 and your stop fills, you lose about $100, or 1% of your account, regardless of how volatile that particular stock is. If the trade works and the stock rises to $58, you'd have an $8 gain per share on 25 shares, or $200, a 2:1 reward-to-risk outcome. In many cases, price simply chops around and you get stopped out for a small loss or scratch. That's normal, and it's exactly why position sizing matters more than any single trade's outcome.
Using Chandelier Exits for Trailing Stops
A chandelier exit is a trailing stop that hangs below the highest high reached since you entered the trade, calculated using an ATR multiple, rather than staying fixed at your original entry-based stop.
The formula is: Highest High Since Entry - (ATR x Multiplier). As the stock makes new highs, the stop rises with it. If the stock stalls or pulls back, most traders ratchet the stop so it only moves up and never down, locking in gains along the way. Keep in mind the raw calculation can tick lower on its own if ATR expands, which is why the ratchet rule matters.
This solves the problem shown in the chart earlier, where a static stop never moves even as price climbs well above it. A chandelier exit keeps your stop proportional to current volatility while still protecting profits as a trend develops.
Combining ATR with Other Indicators for Confirmation
ATR measures volatility, not direction, so we always pair it with a trend or momentum tool to confirm whether a setup is worth taking in the first place.
A common combination we teach is ATR with a moving average for trend direction and the Relative Strength Index (RSI) for momentum confirmation. If price is above a rising 50-day moving average, RSI is holding above 50, and ATR is expanding, that's often a sign of a genuine breakout rather than random noise. Many traders also look for an ATR chart setup that overlays ATR bands directly on price, which makes it easier to visually spot when volatility is expanding or contracting relative to trend.
When Should You Use ATR Position Sizing?
ATR position sizing works best in markets with clear price history and reasonably consistent trading volume, like most liquid stocks, major forex pairs, and actively traded futures contracts. It's less reliable on thinly traded small caps where a single large order can distort the True Range entirely.
When to Avoid It
- Right around earnings announcements or major news events, when ATR from prior days doesn't reflect the sudden volatility ahead
- On extremely low-volume stocks where price gaps make True Range unreliable
- When you're holding positions overnight in markets prone to large gap-opens, since a stop sized off average volatility can be jumped over entirely at the open and fill far below your intended exit
Watch Out: Never risk more than 1-2% of your account on a single trade, regardless of how the ATR math works out. Recalculate ATR regularly since volatility shifts, and cap any single position at no more than 20-25% of your account equity so one trade can't dominate your portfolio.
What Is the 3-5-7 Rule in Trading?
The 3-5-7 rule is a risk management guideline we recommend layering on top of ATR sizing: risk no more than 3% on any single trade (we stay at the more conservative 1-2% end of that range), no more than 5% across related or correlated trades, and no more than 7% in total open risk across your entire portfolio at once.
It pairs naturally with ATR position sizing because ATR tells you how to size each individual trade, while the 3-5-7 rule caps how much total risk you're carrying across all your trades combined. We often see traders stack these two systems together for layered, account-wide risk control rather than relying on either one alone.
Frequently Asked Questions
What is the formula for position sizing?
The standard formula is Position Size = Risk Per Trade divided by the dollar distance between your entry price and your stop price. With ATR, that stop distance is usually 1.5 to 2 times the ATR value.
What is the best ATR period to use?
The 14-period setting is our standard default and works well for most swing traders. Shorter periods like 5 suit fast-moving day trades, while longer periods like 20 to 21 suit longer-term position trades.
What is the best ATR setting for a 5-minute chart?
We generally use a shorter ATR period, often 5 to 10, on 5-minute charts because it reacts faster to intraday volatility shifts than the standard 14-period setting.
Can ATR position sizing be used in forex?
Yes. ATR position sizing for forex works the same way as stocks, just measured in pips instead of dollars, and is especially useful given how volatility varies widely across currency pairs.
Does ATR tell you which direction price will go?
No. ATR only measures the size of price movement, not direction. It needs to be paired with a trend or momentum indicator for directional confirmation. The CME Group offers additional educational resources on volatility-based tools across futures markets if you want to go further with this concept.
Want expert trading insights delivered daily?
Join thousands of traders who rely on Traders Agency for market analysis and trade ideas.
Join Traders AgencyDISCLAIMER: Traders Agency does not offer financial advice. The information provided is for educational purposes only and should not be considered financial advice. Traders Agency is not responsible for any financial losses or consequences resulting from the use of the information provided. Trading carries inherent risks and may not be suitable for all individuals. You are advised to conduct your own research and seek personalized advice before making any investment decisions, recognizing the potential risks and rewards involved.
See more from Traders Agency on Google
Make us a preferred source and our market analysis will appear more prominently in your Google Search, Top Stories, and AI results.
Add to Preferred Sources