
You've probably watched a stock gap 8% the morning after earnings and wondered how traders positioned for that move in advance. Some bought options hoping for a big directional swing. Others sold premium, betting the stock wouldn't move as much as the options market priced in. Both camps were reacting to the same thing: implied volatility. In this guide, we'll show you how to calculate an expected move, pick strikes for straddles, strangles, and iron condors, and decide whether buying volatility or selling it fits your outlook.
What Is the Best Option Strategy During Earnings?
Bottom Line: Choosing between straddles, strangles, and iron condors before earnings comes down to judging whether implied volatility has overpriced or underpriced the likely move, not picking a popular strategy name. Buying premium pays off only if the stock moves beyond the market's expected range, while selling premium via iron condors profits if the stock stays within it, and IV crush hits every position the moment earnings hit regardless of direction.
There is no single best option strategy during earnings. The right choice depends on whether you expect a move larger than the market's priced-in expected move (favoring straddles or strangles) or a move smaller than expected (favoring iron condors).
We teach this as a volatility question first and a direction question second. Earnings reports are one of the few scheduled events where implied volatility reliably spikes beforehand and collapses afterward. That predictable pattern is what every options earnings strategy in this guide is built around.
If you've searched for a one-size-fits-all "option strategy before earnings," the honest answer is that your edge comes from correctly judging whether the options market has overpriced or underpriced the likely move, not from picking a trendy strategy name.
How Does Implied Volatility Drive the Expected Move?
Implied volatility (IV) typically climbs in the days before an earnings release because traders bid up option premiums to account for the unknown. That inflated IV gets built into a number called the expected move: the price range the options market thinks the stock will stay within, based on the price of the at-the-money straddle.
Here's the mechanic we use: take the price of the at-the-money call plus the at-the-money put for the nearest expiration after earnings, multiply by roughly 0.85, and you get a rough one standard deviation expected move in dollar terms.
| Parameter | Value |
|---|---|
| Stock Price | $100 |
| Weekly ATM Straddle | $5.10 call + $4.30 put = $9.40 |
| Expected Move Calculation | $9.40 × 0.85 |
| Expected Move | ~$8.00 |
| Expected Range | $92 to $108 |
This is the single most important number in any options strategy for earnings. Everything else (strike selection, strategy choice, position sizing) flows from it.
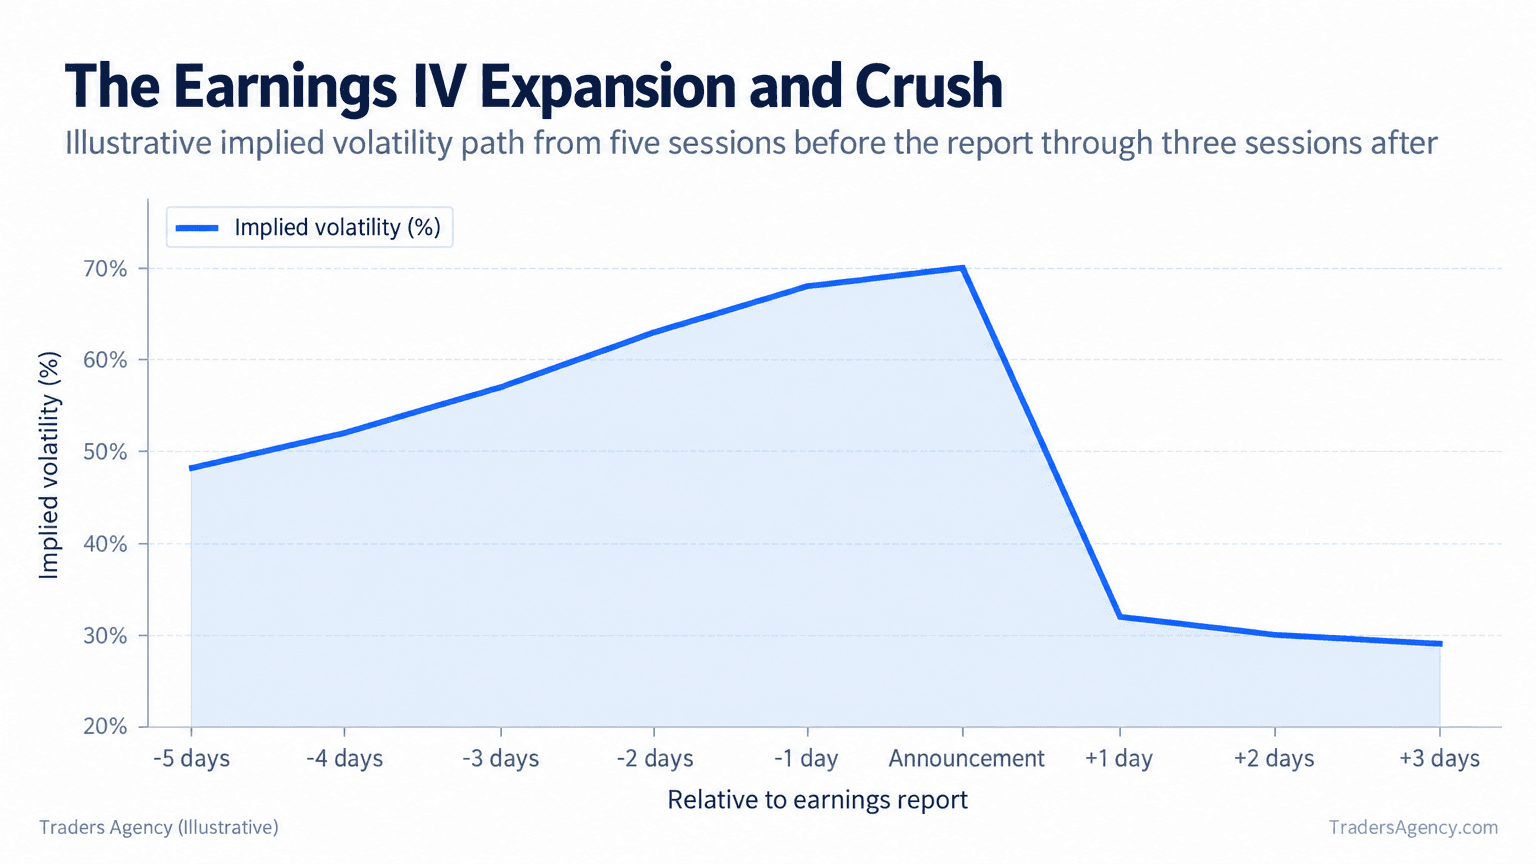
The chart above shows the pattern that makes earnings trading unique: IV rises steadily into the report, then drops sharply the next morning regardless of which direction the stock moves. That drop is the volatility crush, and it's the force that determines whether a long options position makes money even when you're directionally right.
Key Concept: The expected move isn't a prediction, it's a snapshot of what the options market has priced in. Your entire edge in an earnings trade comes from judging whether that number is too high, too low, or about right.
How Do You Pick Strikes for Straddles vs Strangles Before Earnings?
A long straddle buys the at-the-money call and put at the same strike and expiration, profiting if the stock moves more than the market expected, in either direction. A long strangle buys an out-of-the-money call and put, costing less upfront but starting with both legs out-of-the-money, so the stock has to travel past a strike before either leg picks up intrinsic value.
- Step 1: Build the Straddle. Using our $100 stock example, buy the 100-strike straddle for $9.40 total. Breakevens sit at $90.60 and $109.40, meaning the stock needs to clear the expected move on either side just to break even, before the IV crush even factors in.
- Step 2: Build the Strangle. Instead, buy the 95 put for $1.90 and the 105 call for $2.10, paying $4.00 total, less than half the straddle's cost. Breakevens land at $91.00 and $109.00, but both legs start out-of-the-money, so the stock has to move past 95 or 105 before either option has any intrinsic value.
- Step 3: Compare the Trade-Off. The straddle costs more, but both legs start at the money, so it gains intrinsic value on any move and carries higher gamma near the current price. The strangle costs less than half as much, and with these premiums its breakevens actually sit slightly closer to the stock price, but it holds no intrinsic value at all unless the stock clears 95 or 105, and it loses the entire premium anywhere inside that range, which is why we describe it as the higher-variance, lower-cost version of the same bet.
| Strategy | Cost | Breakevens |
|---|---|---|
| Long Straddle (100 strike) | $9.40 | $90.60 / $109.40 |
| Long Strangle (95/105) | $4.00 | $91.00 / $109.00 |
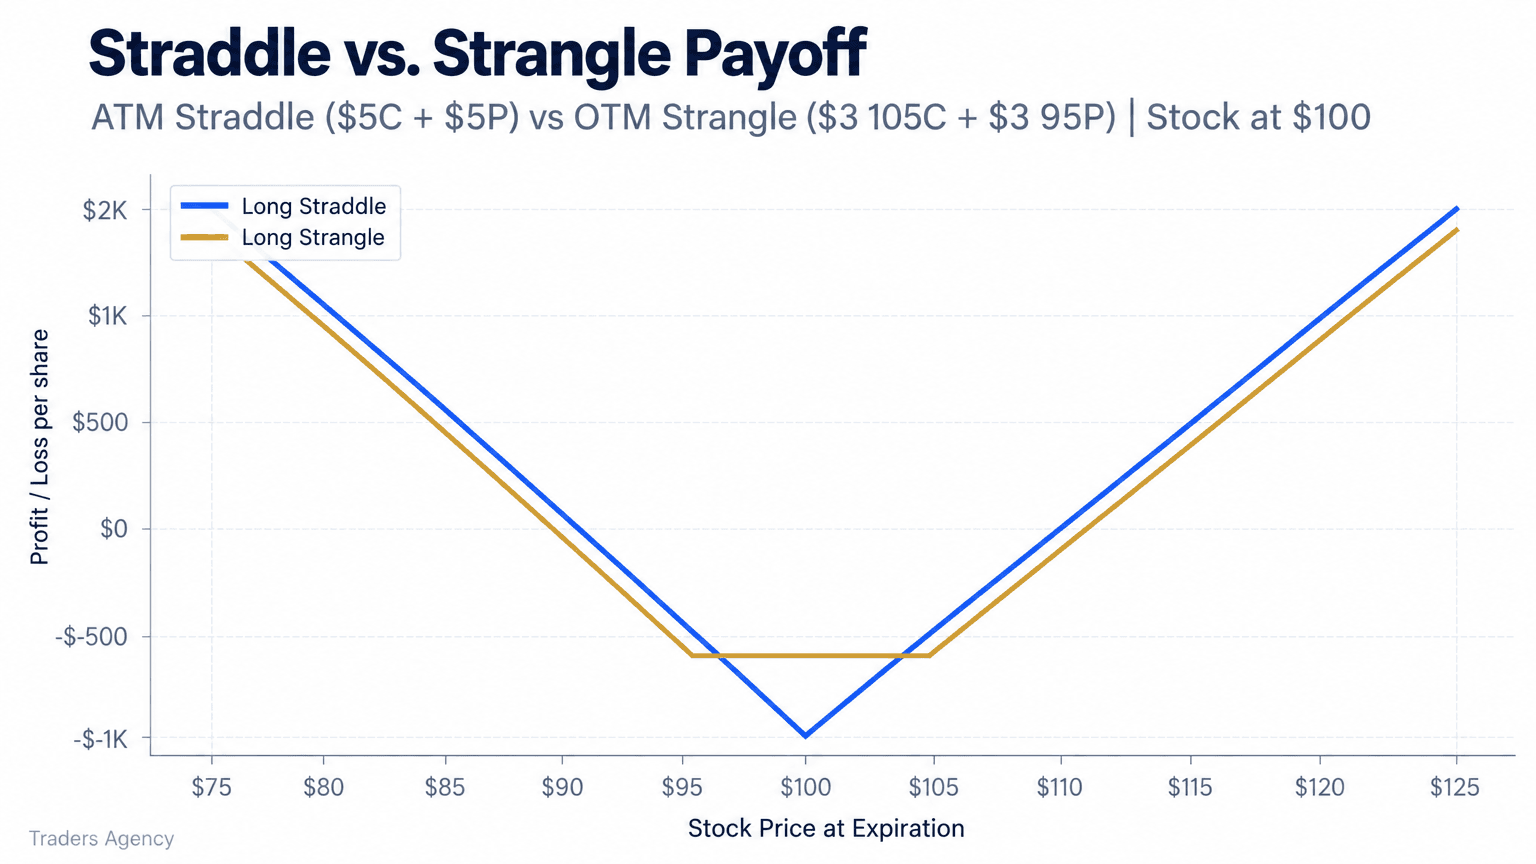
Historically, straddles and strangles bought right before earnings lose money more often than they win, because IV tends to overstate the actual move. That's the core tension every options trader eventually runs into: buying volatility feels intuitive, but the math often favors the sellers.
Want expert trading insights delivered daily?
Join thousands of traders who rely on Traders Agency for market analysis and trade ideas.
Join Traders AgencyIron Condors: Selling Volatility Into Earnings
An iron condor sells an out-of-the-money call and put while buying further out-of-the-money options for protection, collecting a net credit that represents the maximum profit if the stock stays within a range. This is the primary structure behind selling options around earnings rather than buying it.
Setting Up the Trade
- Step 1: Sell the Short Strikes. Sticking with our $100 stock, sell the 90 put and the 110 call.
- Step 2: Buy the Protective Wings. Buy the 85 put and 115 call to cap risk on both sides.
- Step 3: Collect the Credit. This combination collects a net credit of roughly $2.50 per spread.
| Scenario | Stock Price at Expiration | Profit/Loss |
|---|---|---|
| Max Profit | Between $90 and $110 | +$2.50 |
| Breakeven (low) | $87.50 | $0 |
| Breakeven (high) | $112.50 | $0 |
| Max Loss | At or below $85 or at or above $115 | -$2.50 |
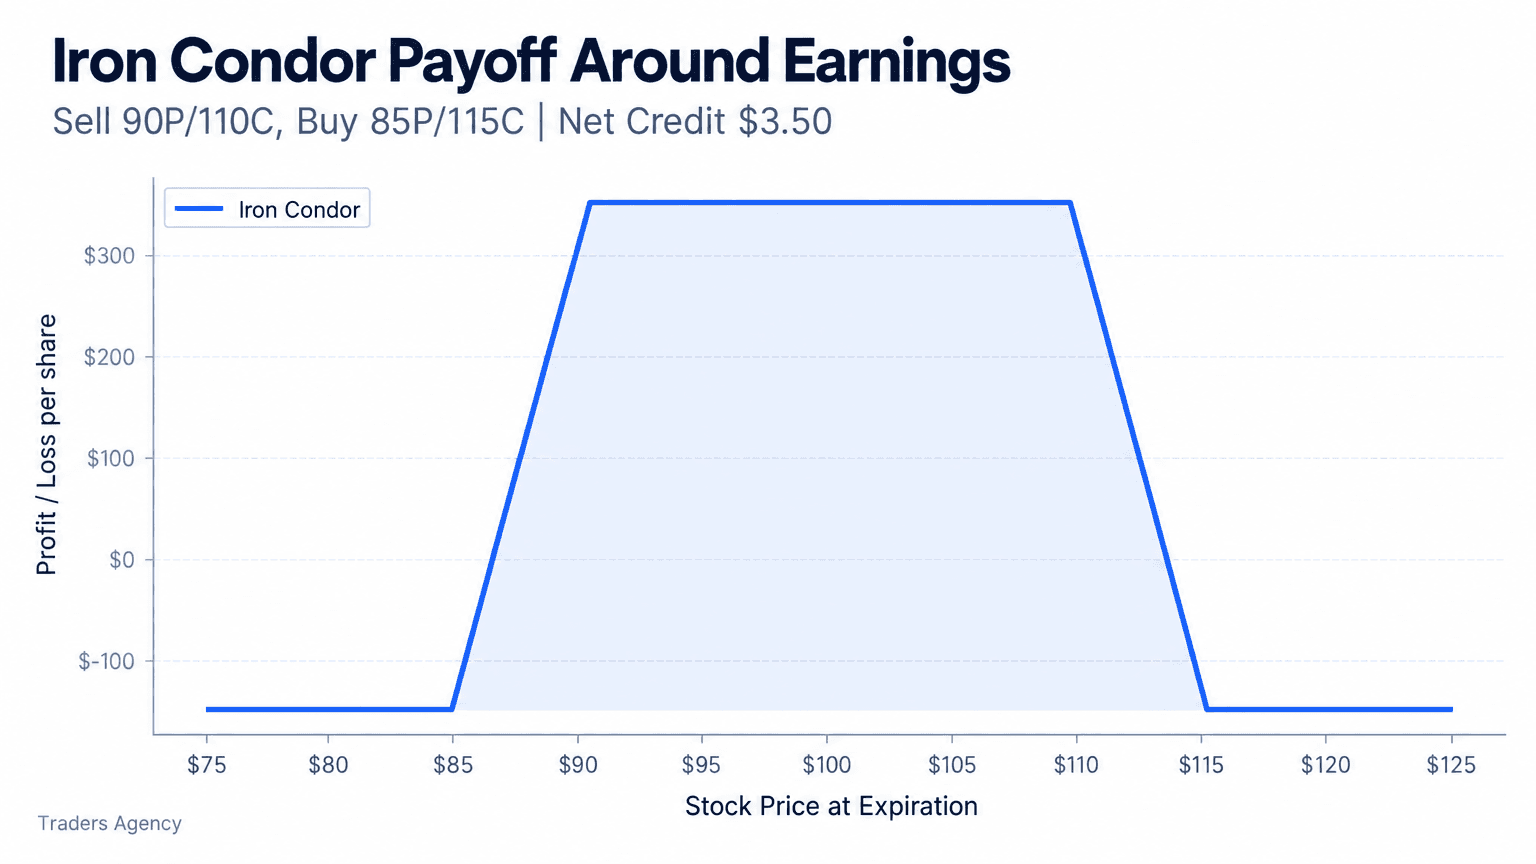
The appeal here is defined risk on both sides combined with a structural edge: theta (time decay) and the coming IV crush both work in the seller's favor, as long as the stock doesn't move beyond the short strikes.
What Happens to Options Prices After a Volatility Crush?
Option prices typically drop sharply the morning after earnings even if the stock barely moves, because the implied volatility that inflated premiums beforehand collapses once the uncertainty is resolved. This is why long options buyers sometimes lose money on a "correct" directional call.
A trader holding a straddle that cost $9.40 might watch the stock move $7 overnight, a sizeable move, and still lose money, because the straddle's remaining value after the IV crush settles below the original cost. Vega (sensitivity to volatility) works against the buyer the instant the report is released.
Condor sellers benefit from the exact same mechanic in reverse. The credit they collected reflects inflated pre-earnings IV, and the crush helps the short options lose value faster, which is good news for the seller's position.
Key Concept: Vega cuts both ways the instant earnings hit. It works against long straddle and strangle buyers and works in favor of iron condor sellers, even when the stock makes a meaningful move.
What Happens When the Actual Move Differs From the Expected Move?
Comparing the expected move to the actual realized move across several hypothetical reports shows how often the options market overstates uncertainty. In our illustrative set of six earnings events, the expected move averaged $7.80 while the realized absolute move averaged closer to $5.90.
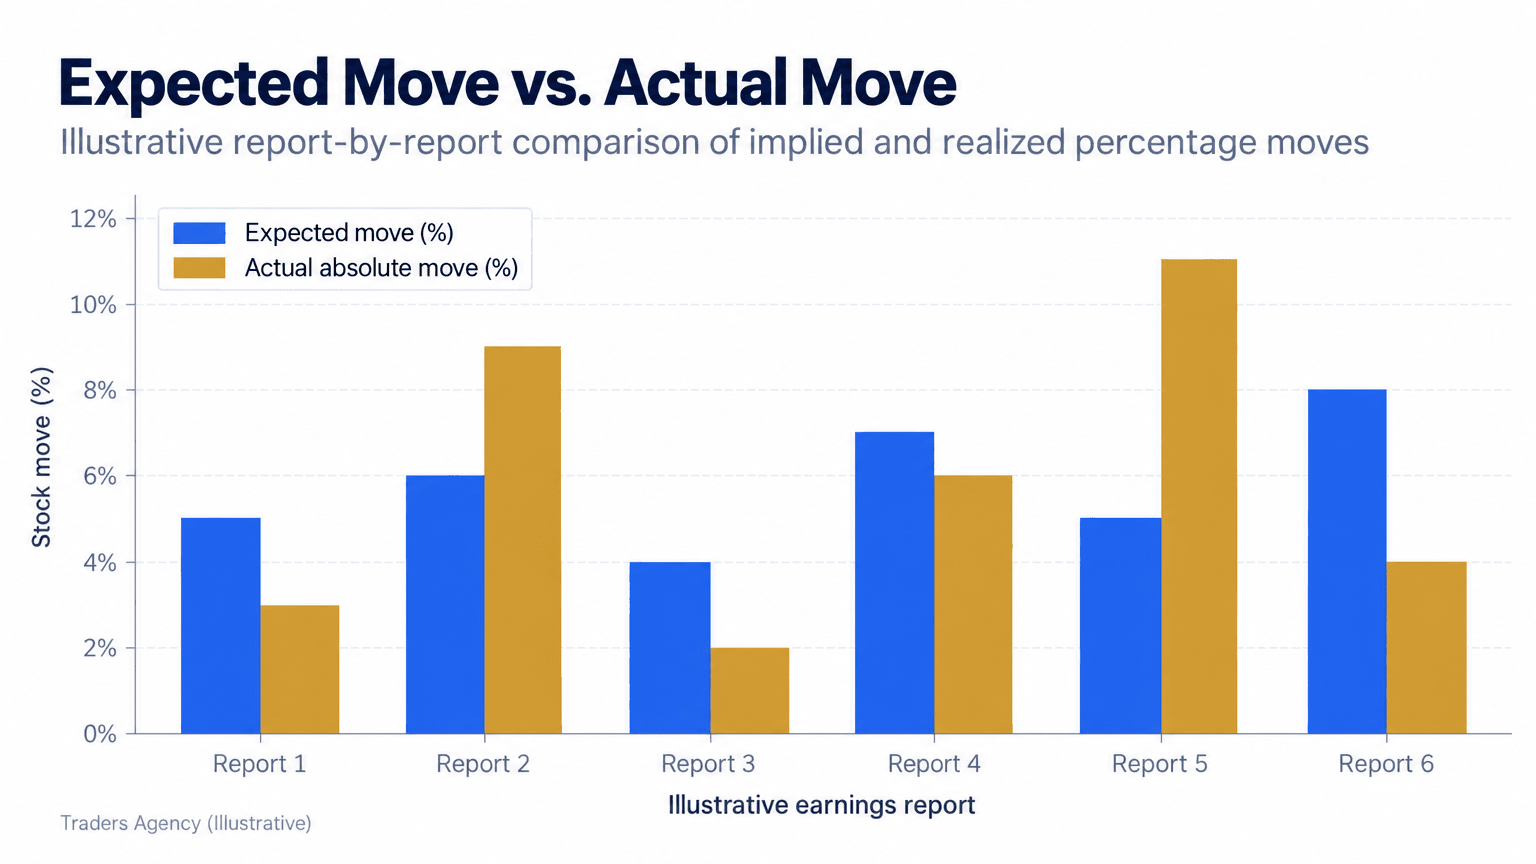
This gap is the entire reason iron condors have historically shown higher win rates than straddles or strangles around earnings, even though each individual loss on a condor can be larger relative to the credit collected. Straddle and strangle buyers need outsized moves to overcome both the premium paid and the IV crush, which happens less often than the headlines about huge earnings gaps would suggest.
Risk Management for Earnings Options Plays
- Size Positions for Total Loss. Earnings trades can move against you overnight with no chance to exit early, so size every straddle, strangle, or condor as if you'll lose 100% of the premium paid or the full max loss on a credit spread.
- Cap Earnings Exposure as a Percentage of Account. We generally suggest keeping any single earnings trade under 1-2% of total account value, given the binary, gap-risk nature of these setups.
- Know Your Exit Before the Report. Decide in advance whether you'll close the position the morning after earnings regardless of outcome. Holding through additional uncertainty after the crush has already happened rarely improves results.
- Watch Liquidity. Stick to underlyings with tight bid-ask spreads on options; wide spreads erode the edge on both buying and selling volatility strategies.
Watch Out: This is not a guarantee of profit in either direction. Earnings outcomes are inherently uncertain, and both volatility buying and volatility selling carry real risk of loss.
Three quick takeaways for comparing options strategies for earnings:
- Buying volatility (straddles, strangles) needs a move bigger than the expected move to profit.
- Selling volatility (iron condors) profits when the stock stays inside the expected range, but caps losses outside it.
- The IV crush affects every position the moment earnings are released, regardless of direction.
We recommend reviewing the educational materials published by options exchanges such as Cboe if you want to go deeper on the math behind implied volatility and expected move calculations. Exchange-published primers are generally a more reliable reference than informal summaries you'll find scattered around the internet.
Want expert trading insights delivered daily?
Join thousands of traders who rely on Traders Agency for market analysis and trade ideas.
Join Traders AgencyDISCLAIMER: Traders Agency does not offer financial advice. The information provided is for educational purposes only and should not be considered financial advice. Traders Agency is not responsible for any financial losses or consequences resulting from the use of the information provided. Trading carries inherent risks and may not be suitable for all individuals. You are advised to conduct your own research and seek personalized advice before making any investment decisions, recognizing the potential risks and rewards involved.
See more from Traders Agency on Google
Make us a preferred source and our market analysis will appear more prominently in your Google Search, Top Stories, and AI results.
Add to Preferred Sources