
Learning how to read an options chain is the single most useful skill you can build before placing your first options trade. Once you understand the layout, an options chain stops looking like a wall of numbers and starts looking like a menu: every row is a contract, every column tells you something about its price and liquidity. By the end of this guide, you'll know how to find an options chain on your broker platform, read every column in it, and spot which contracts are worth trading versus which ones you should skip.
What Is an Options Chain?
Bottom Line: Reading an options chain comes down to checking a few key columns together, strike, bid/ask spread, volume, open interest, and implied volatility, rather than fixating on price alone. Contracts with tight spreads and solid open interest are generally easier to trade, while thin, illiquid chains carry more risk and are worth avoiding until you're comfortable with the layout.
An options chain (sometimes called an option chain) is a list of all the call and put option contracts available for a given stock, organized by expiration date and strike price. Think of it as a menu: the stock is the restaurant, and each row is a different contract you could order, at a different price point.
Every stock with listed options will have its own chain. You'll find this feature on nearly every brokerage platform, including Fidelity and Schwab, usually under a tab labeled "Options" or "Options Chain" on the stock's quote page. The core layout is nearly identical across brokers, even though the colors and button placement differ slightly.
A call option gives the buyer the right (not the obligation) to buy 100 shares of stock at a set price. A put option gives the buyer the right to sell 100 shares at a set price. Options chains display calls and puts side by side so you can compare them at a glance.
How Is the Options Chain Organized?
Most options chains follow the same basic structure: calls on the left, puts on the right, strike prices in the middle. Above the table, you'll select an expiration date, which determines how much time is left before the contracts expire. We teach new traders to work through the chain in this order:
- Step 1: Pick an Expiration Date. Every options chain starts with a row of dates near the top of the screen. These are the expiration dates, the day the contract stops existing. You'll typically see weekly expirations (expiring every Friday), monthly expirations (typically the third Friday of each month), and LEAPS (long-term contracts expiring a year or more out). For beginners, we generally suggest starting with monthly expirations. They tend to have more trading activity than weekly contracts on less popular stocks, which makes them easier to read and trade.
- Step 2: Understand the Center Column. The middle column of the chain lists strike prices, the prices at which the option lets you buy (call) or sell (put) the stock. Strikes are usually listed in ascending order, with the current stock price typically highlighted or shaded differently so you can quickly see where the stock is trading relative to each strike.
How Do I Read the Strike Price Column?
The strike price column tells you the exact price level each contract is tied to, and it determines whether an option is in the money or out of the money. This single column is the anchor point for reading the rest of the chain.
Let's say a stock is trading at $100. The strike price column might list strikes at $90, $95, $100, $105, and $110. Each of those rows represents a different contract, with its own price, for the same expiration date.
- Strikes below the current stock price ($90, $95) mean something different for calls than for puts
- Strikes above the current stock price ($105, $110) flip that relationship
- The strike closest to the current stock price is called at the money
This is where in the money (ITM) and out of the money (OTM) come in. For a call option, any strike below the current stock price is ITM, meaning it already has real value built in. Any strike above the stock price is OTM, meaning it has no intrinsic value yet, only time value. For a put option, it works in reverse: strikes above the current stock price are ITM, and strikes below are OTM.
Key Concept: ITM means a contract already has intrinsic value baked into its price. OTM means it has none yet, only time value. ITM and OTM describe the contract's structure, not whether the trade will be profitable.
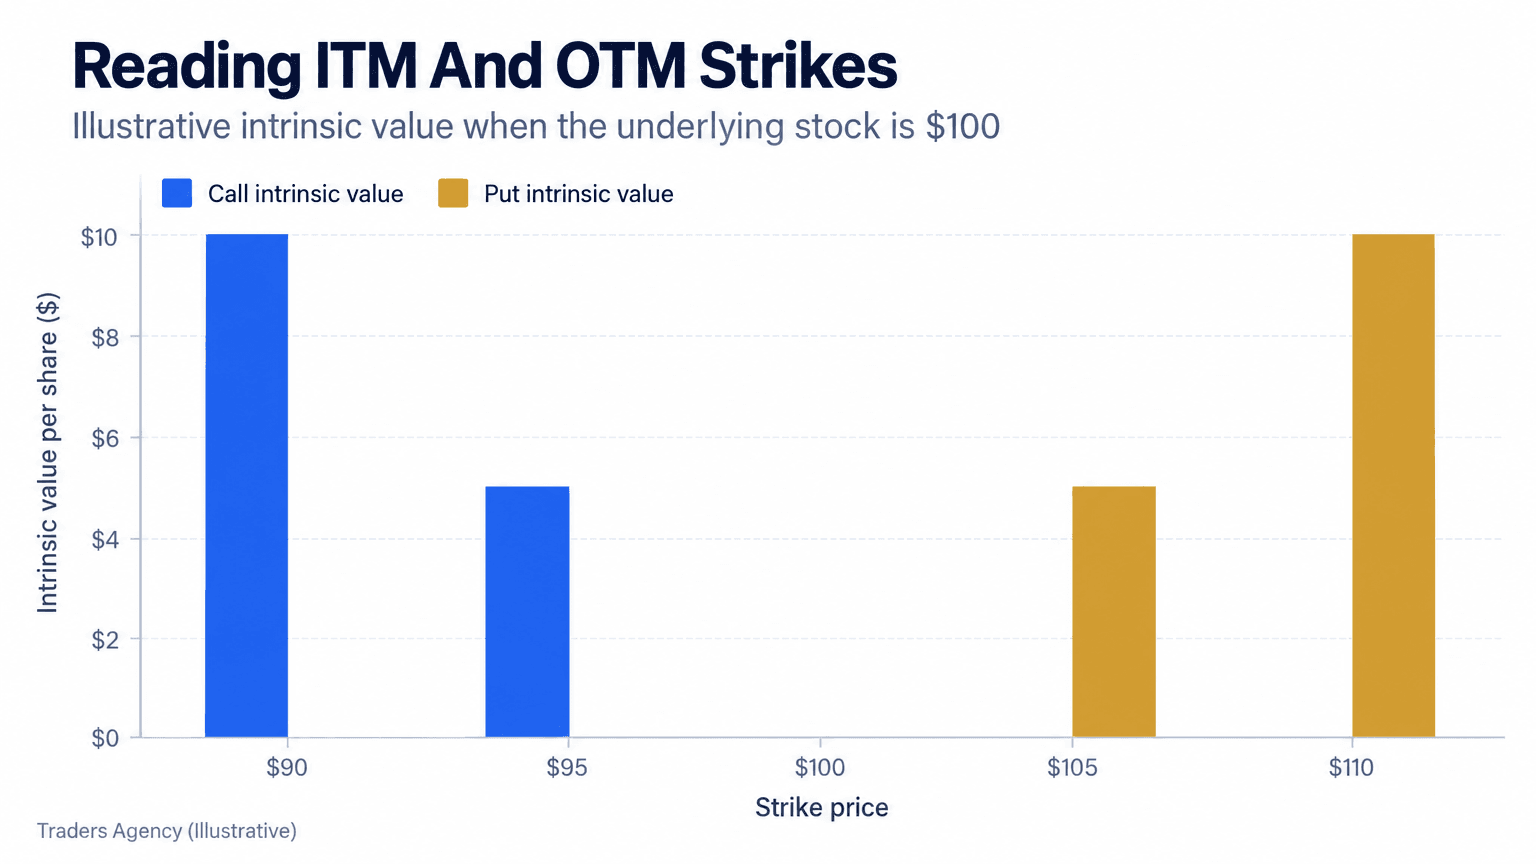
Most brokers shade ITM contracts a different color (often light blue or gray) from OTM contracts (usually white). The exact shading differs between Fidelity, Schwab, and other platforms, but the logic underneath is always the same.
Want expert trading insights delivered daily?
Join thousands of traders who rely on Traders Agency for market analysis and trade ideas.
Join Traders AgencyOptions Chain Example Walkthrough
Let's walk through a full options chain example using a stock trading at $100 with a monthly expiration 30 days away. On the left side, under "Calls," you'd see rows for strikes at $90, $95, $100, $105, and $110. On the right side, under "Puts," the same five strikes appear, but the pricing logic flips.
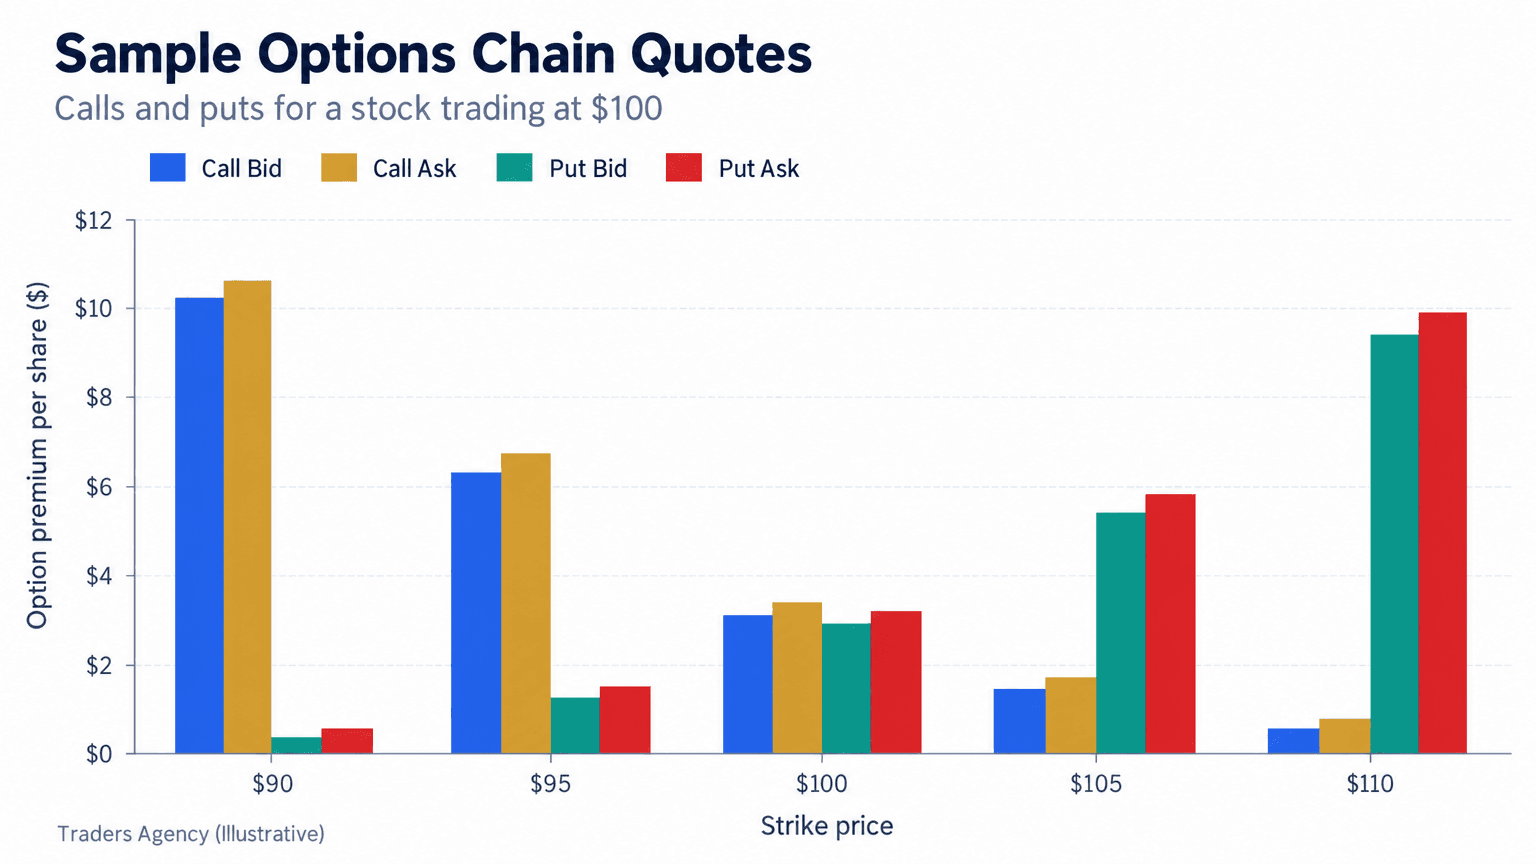
In this illustrative chain, the $95 call (ITM, since it's below the $100 stock price) might show a bid of $6.10 and an ask of $6.30. The $105 call (OTM) might show a bid of $1.40 and an ask of $1.55. Notice how the ITM contract costs more: it already has $5 of built-in value, plus some time value on top.
| Strike | Call Bid | Call Ask | Put Bid | Put Ask |
|---|---|---|---|---|
| $90 | $11.20 | $11.45 | $0.35 | $0.45 |
| $95 | $6.10 | $6.30 | $1.40 | $1.55 |
| $100 (ATM) | $3.00 | $3.15 | $3.00 | $3.15 |
| $105 | $1.40 | $1.55 | $6.10 | $6.30 |
| $110 | $0.35 | $0.45 | $11.20 | $11.45 |
On the put side, the $105 put (ITM, since it's above the stock price) trades at a similar premium to the $95 call, while the $95 put (OTM) is the cheaper contract. This mirror effect is one of the fastest ways to sanity-check that you're reading the chain correctly.
What Do All the Quote Details Mean?
Beyond strike price, each row in the chain includes bid, ask, last price, volume, open interest, and implied volatility. These columns tell you how a contract is priced and how actively it's trading.
- Bid: the highest price a buyer is currently willing to pay
- Ask: the lowest price a seller is currently willing to accept
- Last: the price of the most recent trade
- Volume: how many contracts have traded today
- Open interest: how many contracts are currently open (not yet closed or expired)
- Implied volatility (IV): the market's expectation of how much the stock will move, expressed as a percentage
Implied volatility tends to rise for strikes further from the current stock price, especially on the put side, a pattern we often call a "volatility skew."
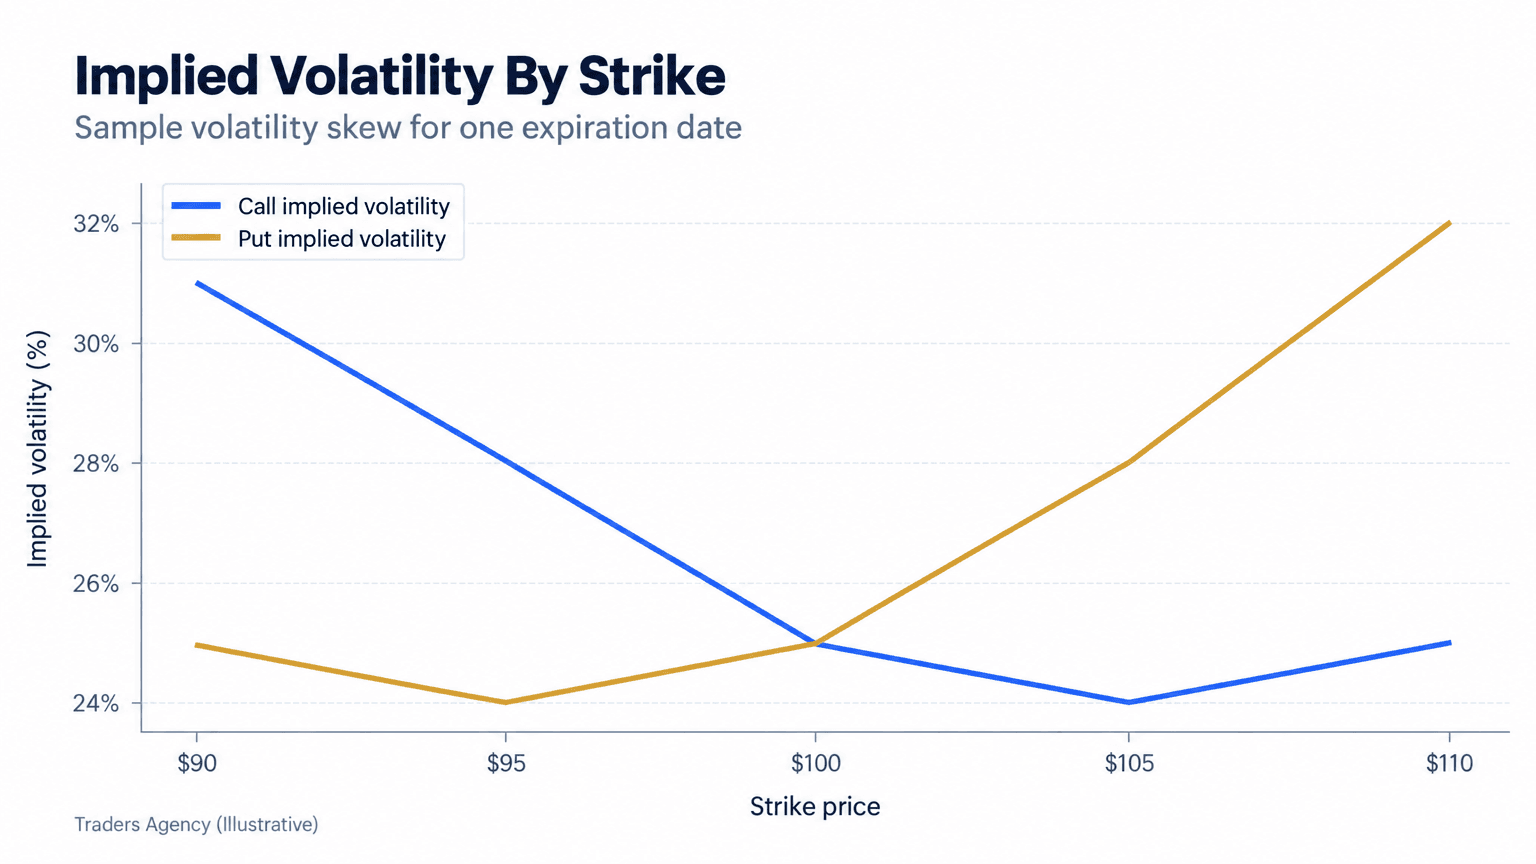
The gap between bid and ask is called the spread. A narrow spread (say, $0.05) suggests an active, liquid contract. A wide spread (say, $1.50 on a $2 option) suggests the opposite, and it can quietly eat into your returns if you trade it.
How Do I Identify Liquid Options?
To identify liquid options, check for high volume and high open interest alongside a tight bid-ask spread. These three signals together tell you whether a contract can be bought and sold easily without losing money to the spread. As a general guideline, we look for:
- Open interest above 100 contracts on the strike you're considering
- Daily volume that's active, not just a handful of trades
- A bid-ask spread under 10% of the option's price, when possible
- Strikes close to the current stock price, since these tend to be the most actively traded
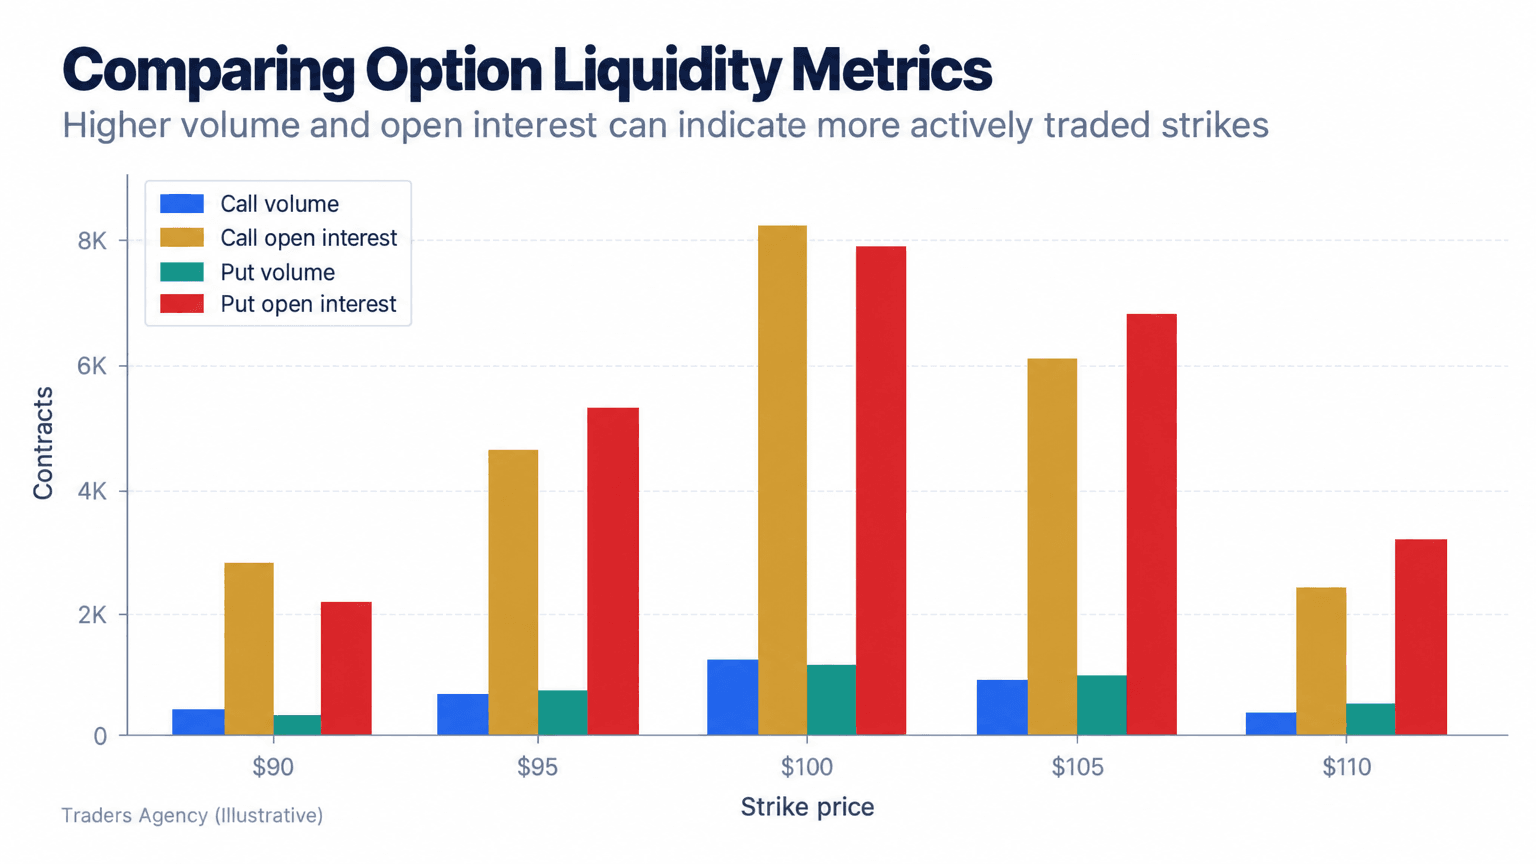
Volume and open interest work together. High volume with low open interest might mean a lot of new positions are opening today. High open interest with low current volume might mean the contract was liquid in the past but has gone quiet. Both matter.
What Mistakes Do Traders Make When Reading an Options Chain?
Most beginner mistakes come down to misreading a column or ignoring liquidity entirely.
- Confusing ITM with "profitable." An ITM option isn't automatically a winning trade, it just has intrinsic value.
- Ignoring open interest. A contract with high volume but zero open interest can still be hard to exit.
- Trading far OTM options for cheap premiums. These look attractive but often have wide spreads and low odds of paying off.
- Overlooking implied volatility. Buying options when IV is unusually high means you're paying extra for that expectation of movement.
- Not checking the expiration date carefully. Mixing up weekly and monthly expirations is a common, costly slip.
Watch Out: 1 standard equity option contract typically represents 100 shares of the underlying stock. Premiums are quoted per share, so a $2.00 premium actually costs $200 per contract, not $2.
How Do I Interpret an Option Chain?
To interpret an option chain, scan the strike prices relative to the current stock price, compare bid-ask spreads for cost efficiency, and check volume and open interest for liquidity before considering the premium itself. Reading top to bottom and left to right, in that order, helps you build a mental picture fast: where is the stock trading, which strikes are ITM versus OTM, and which contracts actually have enough activity to trade safely.
A quick note on a commonly searched term: the 3-5-7 rule in options trading refers to a risk management guideline some traders use, generally suggesting limiting individual trade risk to around 3% of account capital, exposure to any single strategy or market to around 5%, and total portfolio risk from all open trades to around 7%. It's a sizing framework, not a chain-reading concept, but it comes up often in the same conversations.
When Should You Use This Skill?
Reading an options chain is useful any time you're evaluating a new trade idea, whether you're buying a call, selling a covered call, or checking how expensive protection (puts) has become on a stock you own.
- Use it before every trade, not just once when you're learning
- Avoid trading in illiquid chains where spreads are wide and open interest is thin
- Pair it with a basic price chart of the underlying stock so your strike selection lines up with actual support and resistance levels
- Start small while you're still getting comfortable, one contract at a time, until the layout becomes second nature
If you want a quick reference to keep next to your screen while you practice, jotting down the column order (strike, bid, ask, volume, open interest, IV) on an index card works just as well while you're building the habit.
Want expert trading insights delivered daily?
Join thousands of traders who rely on Traders Agency for market analysis and trade ideas.
Join Traders AgencyDISCLAIMER: Traders Agency does not offer financial advice. The information provided is for educational purposes only and should not be considered financial advice. Traders Agency is not responsible for any financial losses or consequences resulting from the use of the information provided. Trading carries inherent risks and may not be suitable for all individuals. You are advised to conduct your own research and seek personalized advice before making any investment decisions, recognizing the potential risks and rewards involved.
See more from Traders Agency on Google
Make us a preferred source and our market analysis will appear more prominently in your Google Search, Top Stories, and AI results.
Add to Preferred Sources