
A short squeeze happens when a heavily shorted stock rises fast enough that traders betting against it are forced to buy shares to close their positions, which pushes the price up even further. We're going to show you how to spot a short squeeze before it accelerates, which means tracking a specific set of metrics, not just watching price action. By the end of this guide, you'll know exactly which numbers to check, what a real squeeze looked like in practice, and why most squeeze plays still end badly for the traders who chase them.
You've probably seen this happen: a stock nobody's talking about suddenly jumps 40% in a day, message boards light up, and by the time you open your brokerage app it's already up another 20%. That's usually the back half of a squeeze, not the start of one. We want to show you how to catch the setup earlier, with real metrics instead of hindsight.
This isn't a strategy we recommend building a core portfolio around. It's a high-volatility, situational play that requires discipline most traders don't bring to it.
What Is a Short Squeeze and How Does It Work?
Bottom Line: Spotting a short squeeze early means tracking metrics like short interest and days to cover before price action explodes, not reacting after the jump already shows up on a chart. Even with the right setup identified, squeeze plays remain high-volatility and often unprofitable for traders who buy in once the move is already underway.
A short squeeze occurs when short sellers, who borrowed and sold shares betting the price would fall, are forced to buy those shares back as the price rises against them. That buying adds fuel to the rally, which triggers more forced buying, creating a feedback loop that can send a stock up dramatically in a short period.
Here's the mechanic in plain terms: a short seller borrows shares and sells them, hoping to buy them back cheaper later. If the price rises instead of falls, that trader is losing money on an open-ended basis. Unlike a long position, there's no floor to a short loss since a stock can theoretically rise forever. At some point, brokers issue margin calls, or the short seller simply decides the pain is too great, and they buy shares to close the position.
When a large percentage of a stock's available shares are sold short, and something pushes the price up, many short sellers get squeezed at once. That collective buying is what separates a short squeeze from a normal rally.
Key Concept: A short squeeze is a feedback loop. Rising prices force short sellers to buy, and that buying pushes prices up further, forcing even more short sellers to buy.
The opposite of a short squeeze is sometimes called a "long squeeze," or simply a sharp sell-off that forces long holders to dump shares, though that term is used far less often because the mechanics are less self-reinforcing. Longs selling doesn't force other longs to sell the way shorts covering forces other shorts to cover.
How Can You Tell if a Short Squeeze Is Coming?
You can tell a short squeeze may be coming by checking a stock's short interest as a percentage of float, its short interest ratio (days to cover), and its cost to borrow. When all three are elevated and rising together, combined with a price trigger, the setup for a squeeze is in place.
No single number guarantees a squeeze. What we're really doing when we teach you how to spot a short squeeze in stocks is building a checklist of conditions that make a squeeze possible, then watching for the trigger that makes it actual.
1. Short Interest as a Percentage of Float
This tells you what portion of a stock's tradable shares (the float) are currently sold short. Generally, anything above 20% is considered elevated, and levels above 30-40% start to look like genuine squeeze territory.
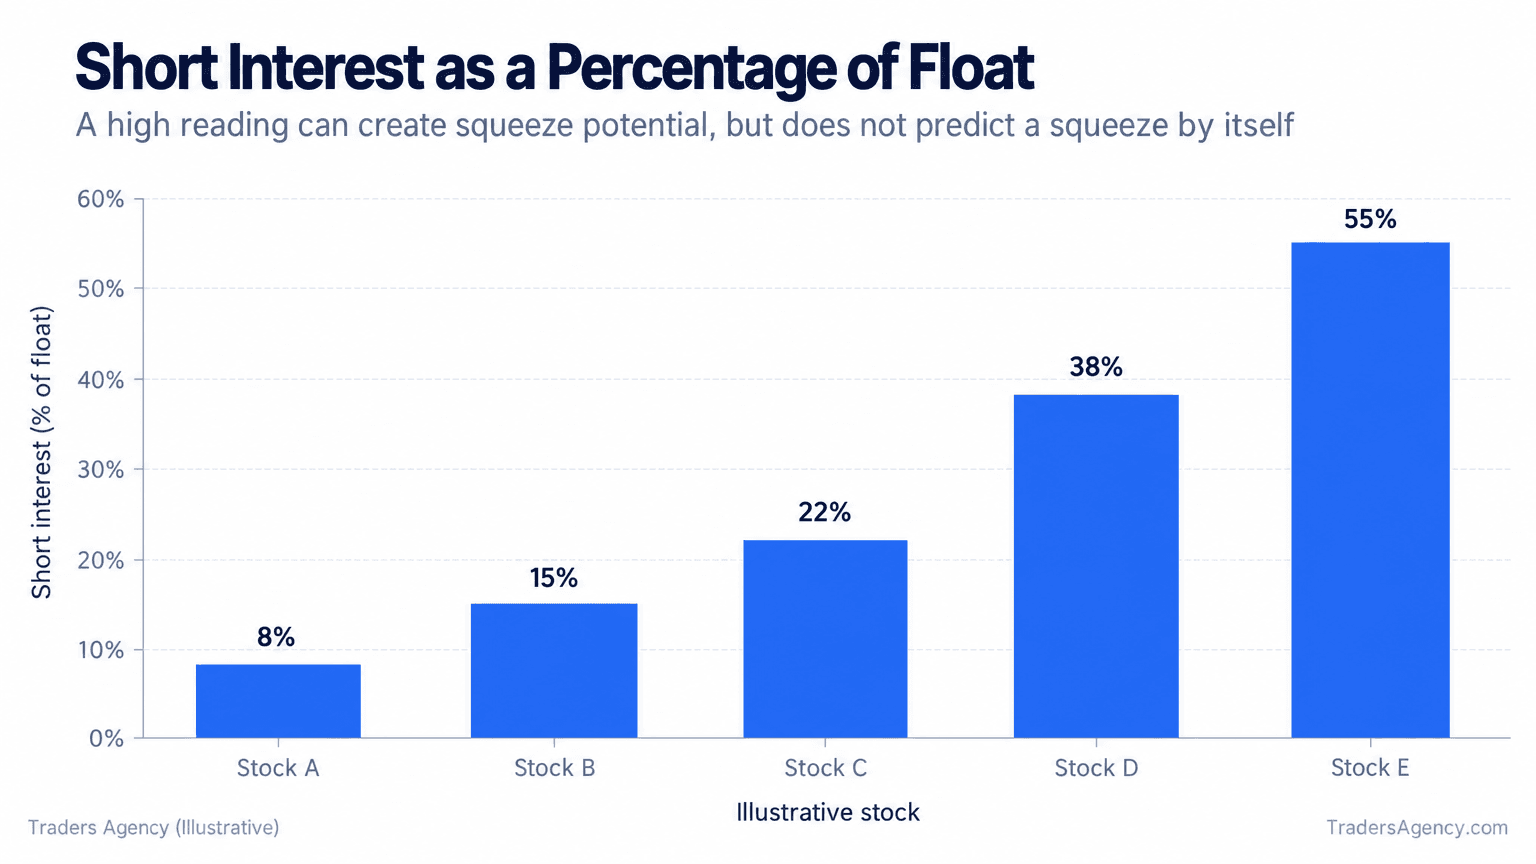
A stock with 8% short interest is unlikely to squeeze in any meaningful way, even on good news. A stock sitting at 50-55% is a completely different animal, where a relatively modest piece of news can set off a chain reaction.
2. Short Interest Ratio (Days to Cover)
This metric divides total shares shorted by the stock's average daily trading volume. It estimates how many trading days it would take for all short sellers to close their positions if they all tried at once.
A days-to-cover ratio above 5 is worth watching. Above 10, you're looking at a stock where short sellers genuinely cannot exit quickly without moving the price against themselves, which is exactly the kind of imbalance that fuels a squeeze.
3. Cost to Borrow
This is the fee short sellers pay to borrow shares, expressed as an annualized percentage. When a stock's cost to borrow spikes into double or triple digits, it signals that shares are scarce and demand to short, or to cover, is intense.
| Metric | Watch Level | Squeeze-Territory Level |
|---|---|---|
| Short Interest % of Float | Above 20% | Above 30-40% |
| Days to Cover | Above 5 | Above 10 |
| Cost to Borrow | Rising sharply | Double or triple-digit annualized rates |
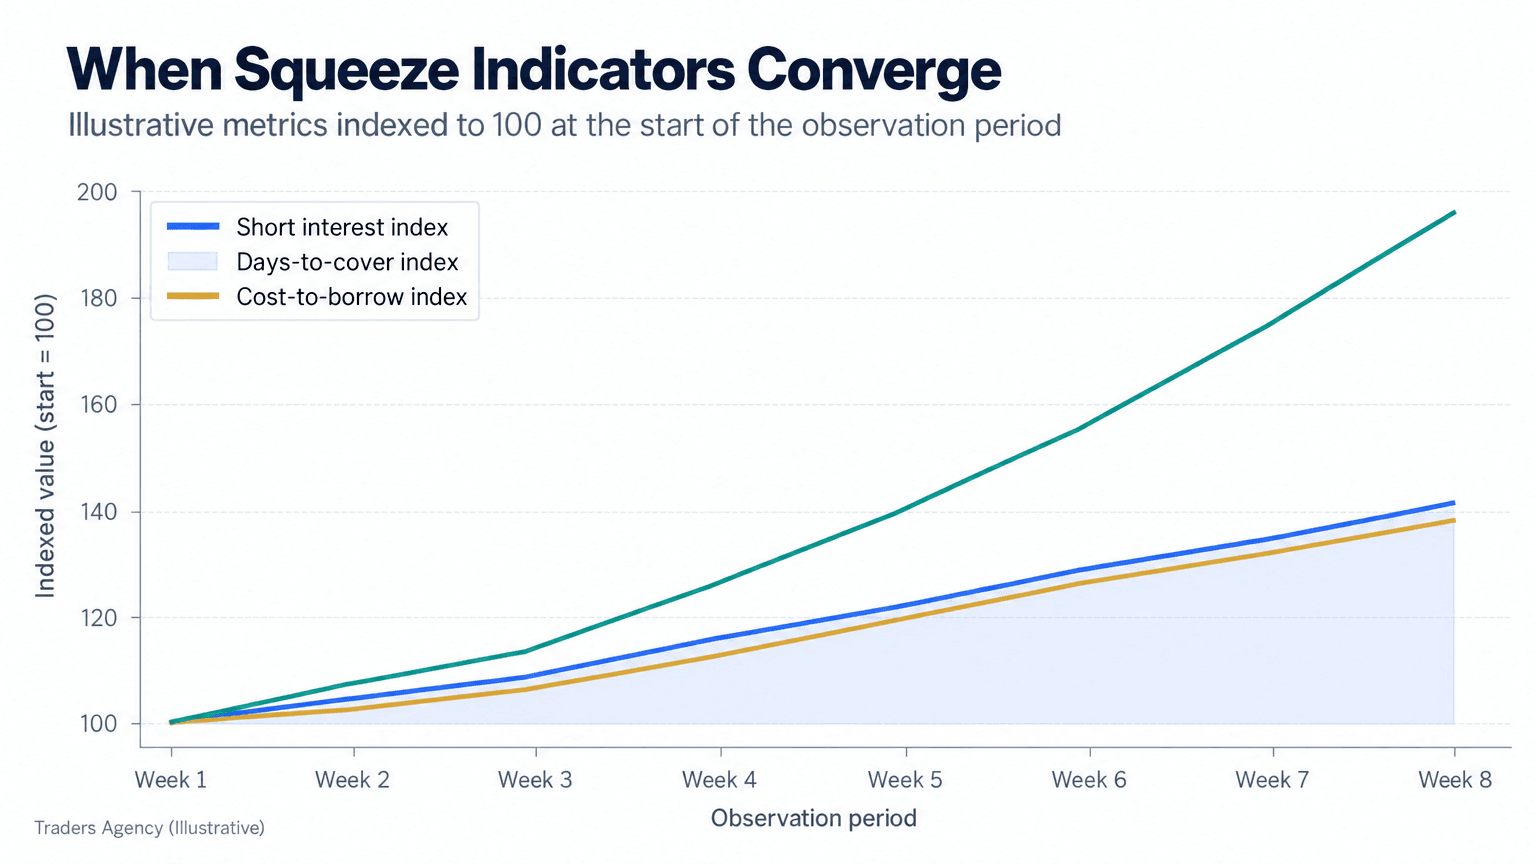
When short interest, days to cover, and cost to borrow all climb at the same time, that convergence is a far stronger signal than any one metric alone. This is also why "how to spot a short squeeze" discussions across trading forums tend to circle back to these same three numbers: traders learned early that these metrics, however imperfect, are the clearest public data available on short-seller positioning.
Want expert trading insights delivered daily?
Join thousands of traders who rely on Traders Agency for market analysis and trade ideas.
Join Traders AgencyWhat Triggers a Short Squeeze?
A short squeeze is typically triggered by a price-moving event, like strong earnings, a buyout rumor, or coordinated retail buying, that pushes a heavily shorted stock's price up enough to force short sellers into covering. The trigger matters less than the underlying short interest it's acting on.
Common triggers include:
- Earnings surprises that beat expectations when the market was positioned for a miss
- News events such as partnership announcements, regulatory approvals, or buyout speculation
- Coordinated retail buying, often organized through social media or forums
- Options-driven gamma squeezes, where heavy call buying forces market makers to buy shares to hedge, adding to upward pressure
- Short-seller reports being proven wrong, which can cause a rush to cover
What Did the GameStop Short Squeeze Look Like in Action?
The clearest modern short squeeze example is GameStop (GME) in January 2021. Short interest at one point exceeded 100% of the available float, meaning some shares had been borrowed and shorted more than once as they changed hands.
GME traded around $17 in early January 2021. Retail buying pressure, amplified heavily through social media, combined with that extreme short interest and a wave of call-option buying that triggered market-maker hedging. By January 27, 2021, GME closed near $348.
| Date | Approximate Closing Price | What Was Happening |
|---|---|---|
| Early January 2021 | $17 | Elevated short interest, low public attention |
| Mid-January 2021 | Rising sharply | Retail buying accelerates, early covering begins |
| January 27, 2021 | $348 | Peak of forced covering and options hedging |
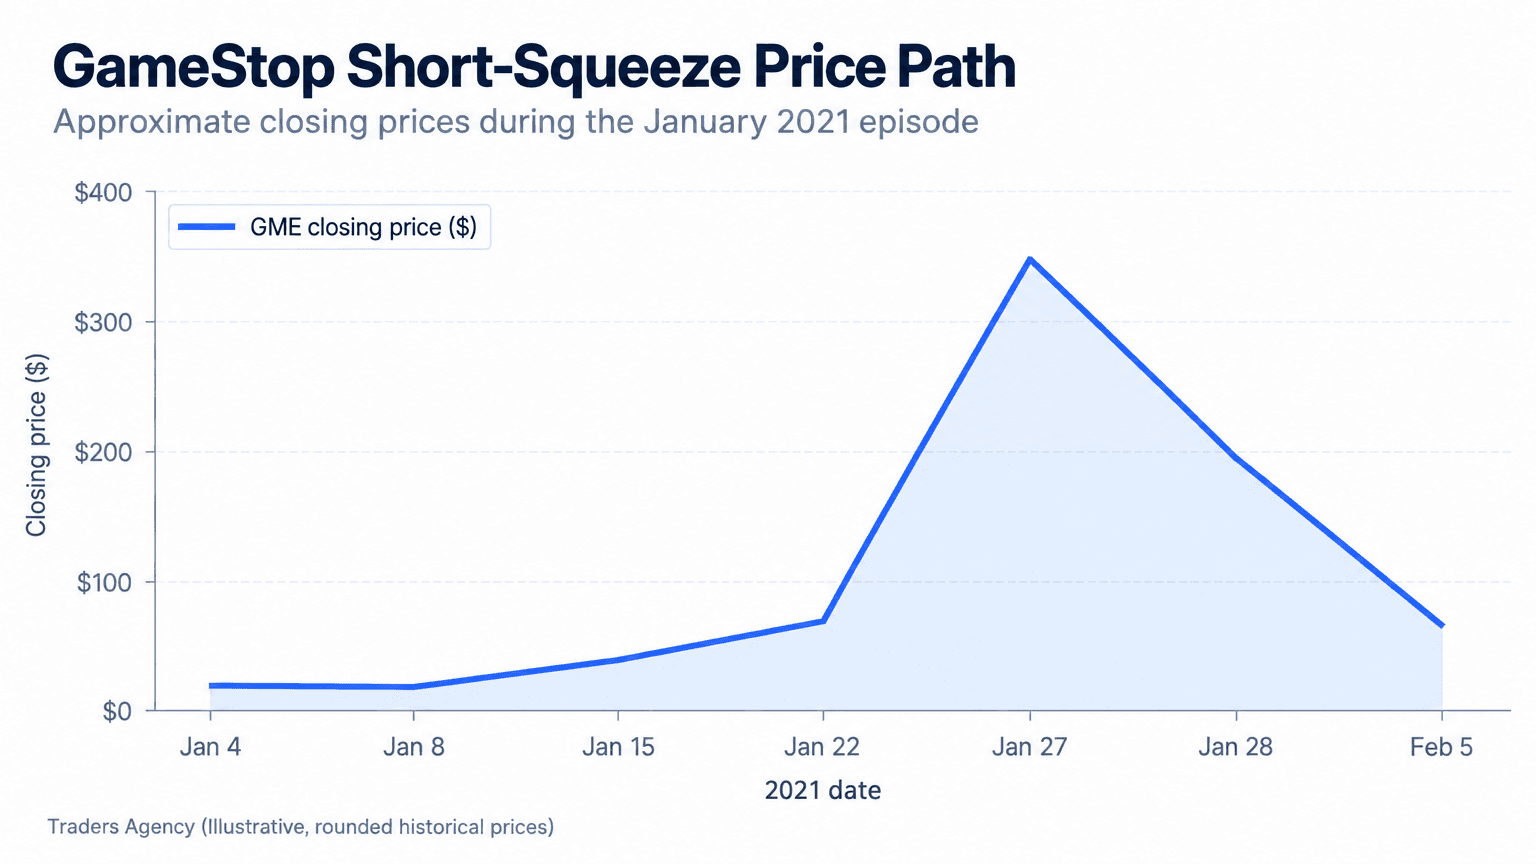
That move wasn't driven by a change in GameStop's underlying business. It was driven almost entirely by the mechanics described above: extreme short interest, limited float, a trigger, and a feedback loop between forced share buying and forced options hedging. This is the textbook case we point to whenever someone asks what a short squeeze actually looks like in practice.
The U.S. Securities and Exchange Commission published a detailed staff report reviewing the GameStop episode, and most major options exchanges, including Cboe, publish educational material on how options-driven hedging can amplify stock moves during events like this.
Why Do Most Short Squeeze Plays Fail?
Here's the part most retail-trading content skips: the vast majority of stocks with high short interest never squeeze, and most traders who buy into a squeeze after it's already started lose money. Short sellers are often short for a reason, usually a deteriorating business, excessive valuation, or looming dilution.
What happens after a short squeeze matters just as much as what happens during one. Once the forced buying is exhausted, there's often no fundamental demand left to hold the price up, and the stock can fall as fast as it rose, sometimes below where it started.
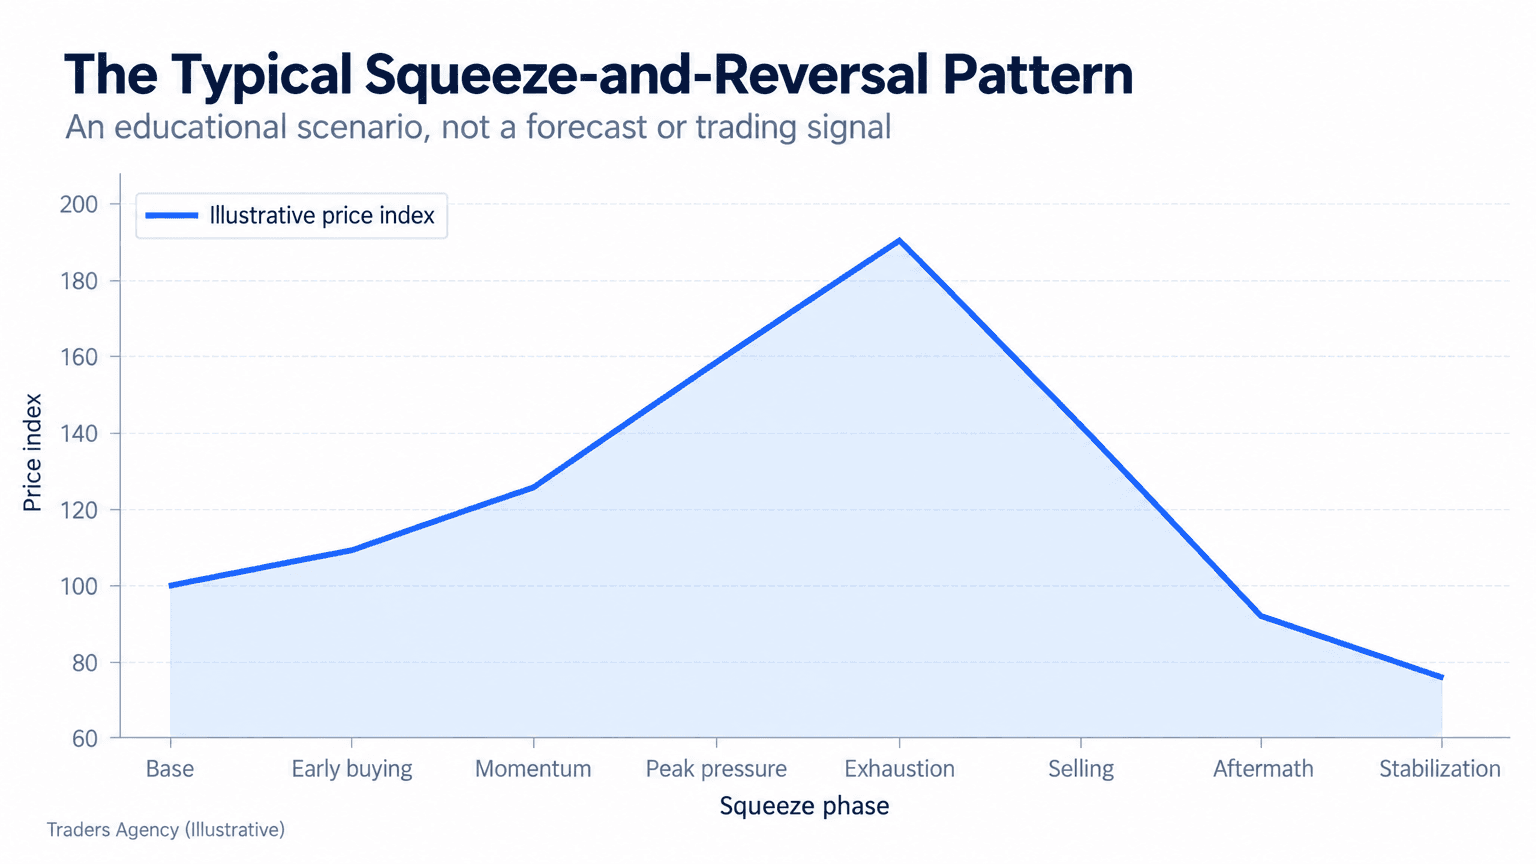
Is a short squeeze good or bad for traders? It depends entirely on timing. For the short sellers caught in it, it's unambiguously painful. For early long positions, it can be extremely profitable. For traders who jump in after seeing a stock already up 100-200% on social media, it's frequently a losing trade, since they're buying from the exact people who got in early and are now looking for an exit.
Watch Out: Common mistakes we see include chasing a stock after it's already up triple digits, treating any "top short squeeze stocks" list as a buy list instead of a watchlist, ignoring how fast cost to borrow and days-to-cover can reverse, sizing positions as if volatility will stay low, and holding through the decline out of hope after missing the actual run-up.
Playing the Squeeze on the Long Side?
If you choose to take a long position in a potential squeeze setup, we treat it as a small, high-risk allocation, not a core position. Here's the process we follow:
- Step 1: Confirm the setup. Check that short interest as a percentage of float, days to cover, and cost to borrow are all elevated and rising together, not just one metric in isolation.
- Step 2: Size the position small. We put a fraction of what we'd allocate to a standard long position into a squeeze trade, often 1-2% of a trading account or less, because the downside can be as fast and severe as the upside.
- Step 3: Set a defined stop loss before entering. This matters more here than in almost any other setup, because squeeze stocks can gap sharply against you overnight on news with no chance to exit at your intended price.
- Step 4: Scale out into strength. We prefer taking partial profits on the way up rather than trying to pick the exact top, since squeeze peaks are notoriously difficult to call in real time.
This approach pairs with, rather than replaces, the fundamental and technical analysis you already use. Short interest metrics are a screening layer on top of your normal process, not a replacement for checking a company's actual balance sheet and chart structure.
Frequently Asked Questions
How to tell if a short squeeze is coming?
Watch for rising short interest as a percentage of float (above 20%), a short interest ratio above 5 days to cover, and a climbing cost to borrow, especially when a potential trigger like earnings is approaching.
What triggers a short squeeze?
Earnings surprises, major news, coordinated retail buying, and gamma squeezes from heavy options buying are the most common triggers, acting on a base of already-high short interest.
What stock is most likely to short squeeze?
Stocks with short interest above 20-30% of float, a high days-to-cover ratio relative to volume (over 5), and a high cost to borrow are the most structurally primed candidates, though a trigger is still required.
How long does it take for a short squeeze to happen?
It varies widely. Some squeezes unfold over a single trading session, while others, like GameStop in January 2021, build over roughly two to three weeks before peaking.
What happens after a short squeeze?
Once forced covering is exhausted, prices frequently fall back toward or below pre-squeeze levels, since the move wasn't driven by underlying business fundamentals.
Is a short squeeze good or bad?
It depends on your position and timing. It's painful for short sellers and highly profitable for early longs, but risky and often unprofitable for traders who buy in after the move is already underway.
What is the opposite of a short squeeze?
Sometimes called a long squeeze, this is a rapid price decline that forces long holders to sell, though it lacks the same self-reinforcing mechanics since long selling doesn't force other longs to sell.
What does short squeeze actually refer to?
It refers to a stock where heavy short-seller positioning, combined with rising prices, forces those short sellers to buy shares to close positions, accelerating the rally further.
Want expert trading insights delivered daily?
Join thousands of traders who rely on Traders Agency for market analysis and trade ideas.
Join Traders AgencyDISCLAIMER: Traders Agency does not offer financial advice. The information provided is for educational purposes only and should not be considered financial advice. Traders Agency is not responsible for any financial losses or consequences resulting from the use of the information provided. Trading carries inherent risks and may not be suitable for all individuals. You are advised to conduct your own research and seek personalized advice before making any investment decisions, recognizing the potential risks and rewards involved.
See more from Traders Agency on Google
Make us a preferred source and our market analysis will appear more prominently in your Google Search, Top Stories, and AI results.
Add to Preferred Sources