
If you have ever watched a stock keep falling after someone called it "oversold," you've seen the most common misread of the Relative Strength Index (RSI) in action. RSI is a powerful momentum tool, but only when you understand the context behind the number. In this guide, we'll show you what RSI measures, how it's calculated, how to read its signals correctly, and how to avoid the mistake that trips up most new traders.
What Is the Relative Strength Index (RSI)?
Bottom Line: RSI readings only mean something when paired with context like trend direction and support/resistance, treating 70 or 30 as automatic buy/sell triggers is the mistake that trips up most new traders. Used correctly, RSI helps judge whether a price move is losing steam rather than predicting exactly when it will reverse.
RSI is a momentum oscillator built to measure whether an asset has moved too far, too fast, in one direction. It plots a single line between 0 and 100 beneath your price chart, and we watch that line for extreme readings and pattern shifts.
The idea behind it is simple: markets that rise or fall too quickly tend to pause or reverse. RSI captures that by comparing the average size of recent gains against the average size of recent losses over a set lookback period, typically 14 periods. When gains have dominated losses by a wide margin, RSI climbs toward 100. When losses have dominated, it drops toward 0.
Price alone doesn't tell you about the quality or exhaustion of a move. Two stocks can hit the same price level, with one grinding higher calmly and the other spiking on panic buying. RSI helps us separate those situations.
How Do You Use RSI?
Using RSI starts with reading the line's position relative to two key thresholds: 70 and 30. Above 70 suggests the asset may be overbought, below 30 suggests it may be oversold, and the 50 midline often acts as a rough dividing point between bullish and bearish momentum.
But reading RSI well means going beyond those thresholds alone. We teach our members to look at three things together: where the RSI line sits, how it's shaped (curling, flattening, or diverging from price), and what the broader price trend is doing. A reading of 75 in a strong uptrend doesn't carry the same weight as a reading of 75 in a sideways market.
Key Concept: Treat RSI as a confirmation tool first and a standalone signal second. That single shift in mindset prevents most of the losing trades beginners make with this indicator.
The RSI Formula: How It's Calculated
The RSI formula is: RSI = 100 - (100 / (1 + RS)), where RS (Relative Strength) equals the average gain over the lookback period divided by the average loss over that same period. The standard period is 14, meaning 14 candles, days, or bars depending on your chart timeframe.
Here's how we calculate RSI step by step using a simplified example:
- Step 1: Track the data. Record the price change for each of the last 14 periods, separating gains (up days) from losses (down days).
- Step 2: Average the moves. Calculate the average gain and average loss across those 14 periods.
- Step 3: Find RS. Divide average gain by average loss. If average gain is 1.2 and average loss is 0.6, RS equals 2.0.
- Step 4: Plug into the formula. 100 - (100 / (1 + 2.0)) = 100 - 33.3 = 66.7.
- Step 5: Plot the reading. That 66.7 becomes your RSI value, plotted on the 0-100 scale.
| Parameter | Value |
|---|---|
| Average Gain | 1.2 |
| Average Loss | 0.6 |
| Relative Strength (RS) | 2.0 |
| Resulting RSI | 66.7 |
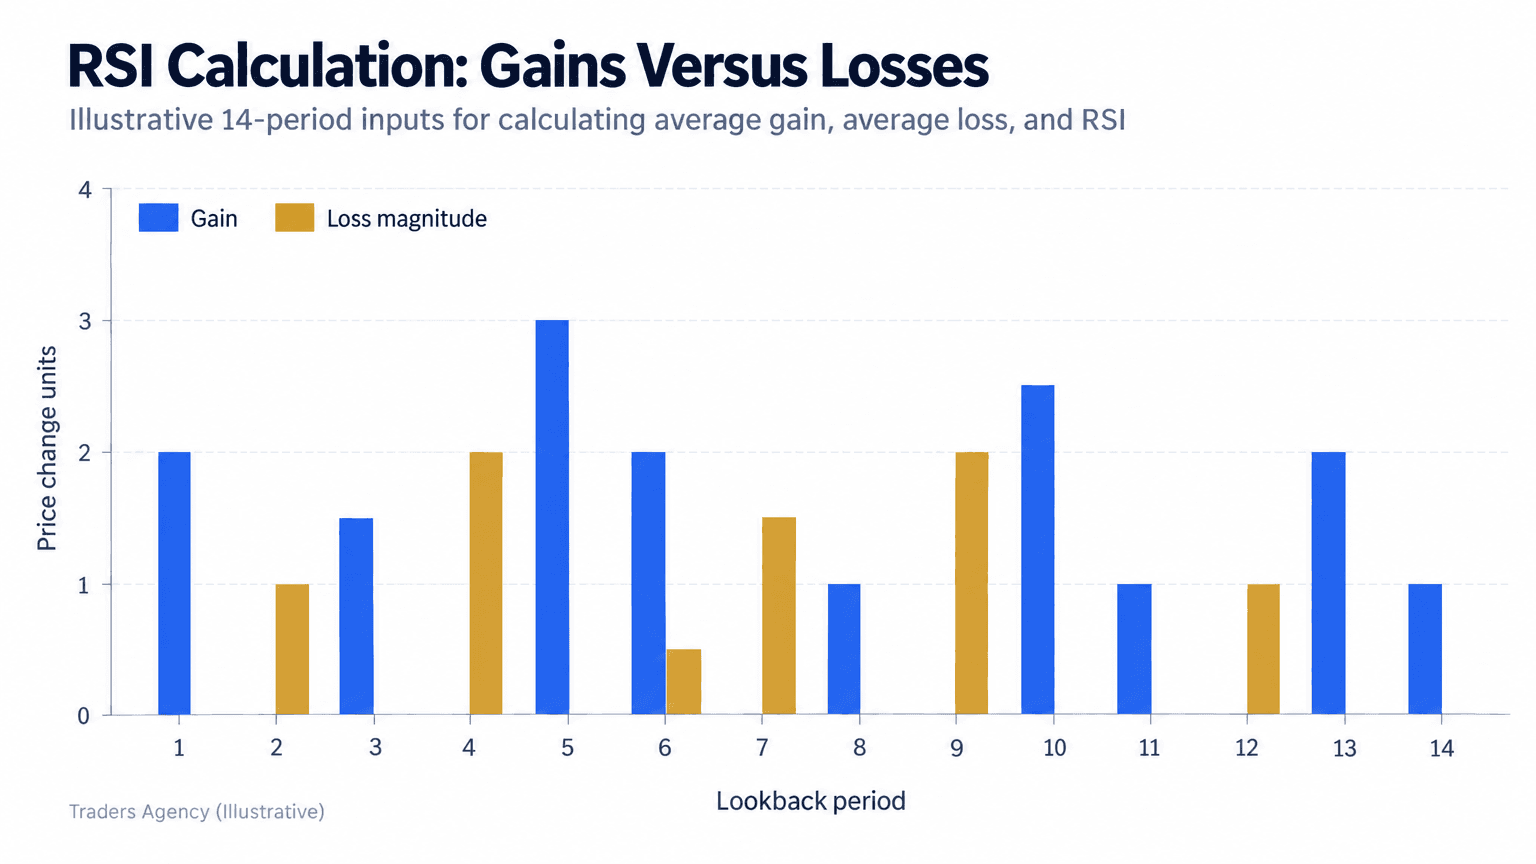
The good news for beginners is that you'll almost never calculate this by hand. Every major charting platform, including TradingView, applies this formula automatically. Knowing the mechanics still matters, because it explains why RSI reacts the way it does when momentum shifts suddenly.
Want expert trading insights delivered daily?
Join thousands of traders who rely on Traders Agency for market analysis and trade ideas.
Join Traders AgencyHow Do You Read Overbought and Oversold RSI Levels?
An RSI reading above 70 signals overbought conditions, meaning price has risen fast enough that a pause or pullback becomes more likely. A reading below 30 signals oversold conditions, meaning a bounce or reversal becomes more likely. Neither reading is an automatic buy or sell signal on its own.
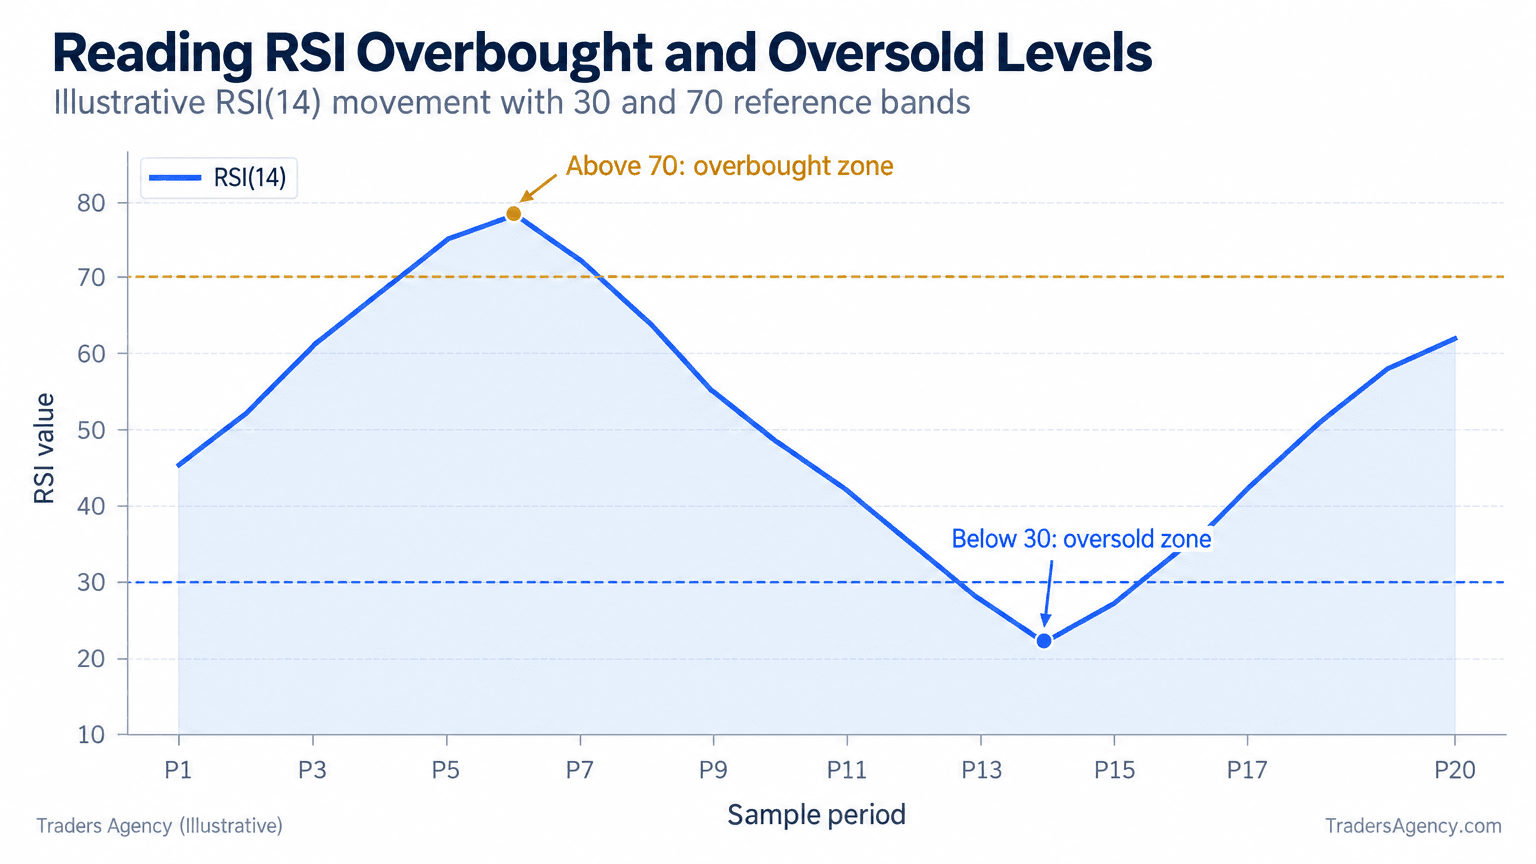
Here's the mistake we see constantly, and it's the one most beginner guides skip entirely: traders see RSI cross above 70 and immediately short the asset, or see it dip below 30 and immediately buy. In a strong trend, RSI can stay above 70 for weeks while price keeps climbing. Selling at the first overbought reading often means exiting a winning trend far too early, or worse, shorting straight into continued strength.
Watch Out: An RSI reading past 70 or below 30 is not an automatic trade signal. In strong trends, RSI can stay extreme for weeks while price keeps moving in the same direction.
So what makes a good RSI level to act on? There's no single magic number, but here's the practical framework we use:
- Look for RSI dropping below 30 and then curling back above it, rather than just touching 30.
- Confirm with price action: is there a support level, a candlestick reversal pattern, or a moving average nearby?
- Check the broader trend. Buying oversold dips works better in uptrends than in confirmed downtrends.
- Wait for volume or momentum confirmation before entering, rather than acting on the RSI cross alone.
The same logic applies in reverse for overbought readings near 70 when considering an exit or short entry.
How Do You Use RSI to Identify a Trend?
RSI isn't only a reversal tool, it's also useful for reading trend strength. In an uptrend, RSI tends to oscillate between 40 and 90, rarely dipping below 40. In a downtrend, it tends to oscillate between 10 and 60, rarely climbing above 60.
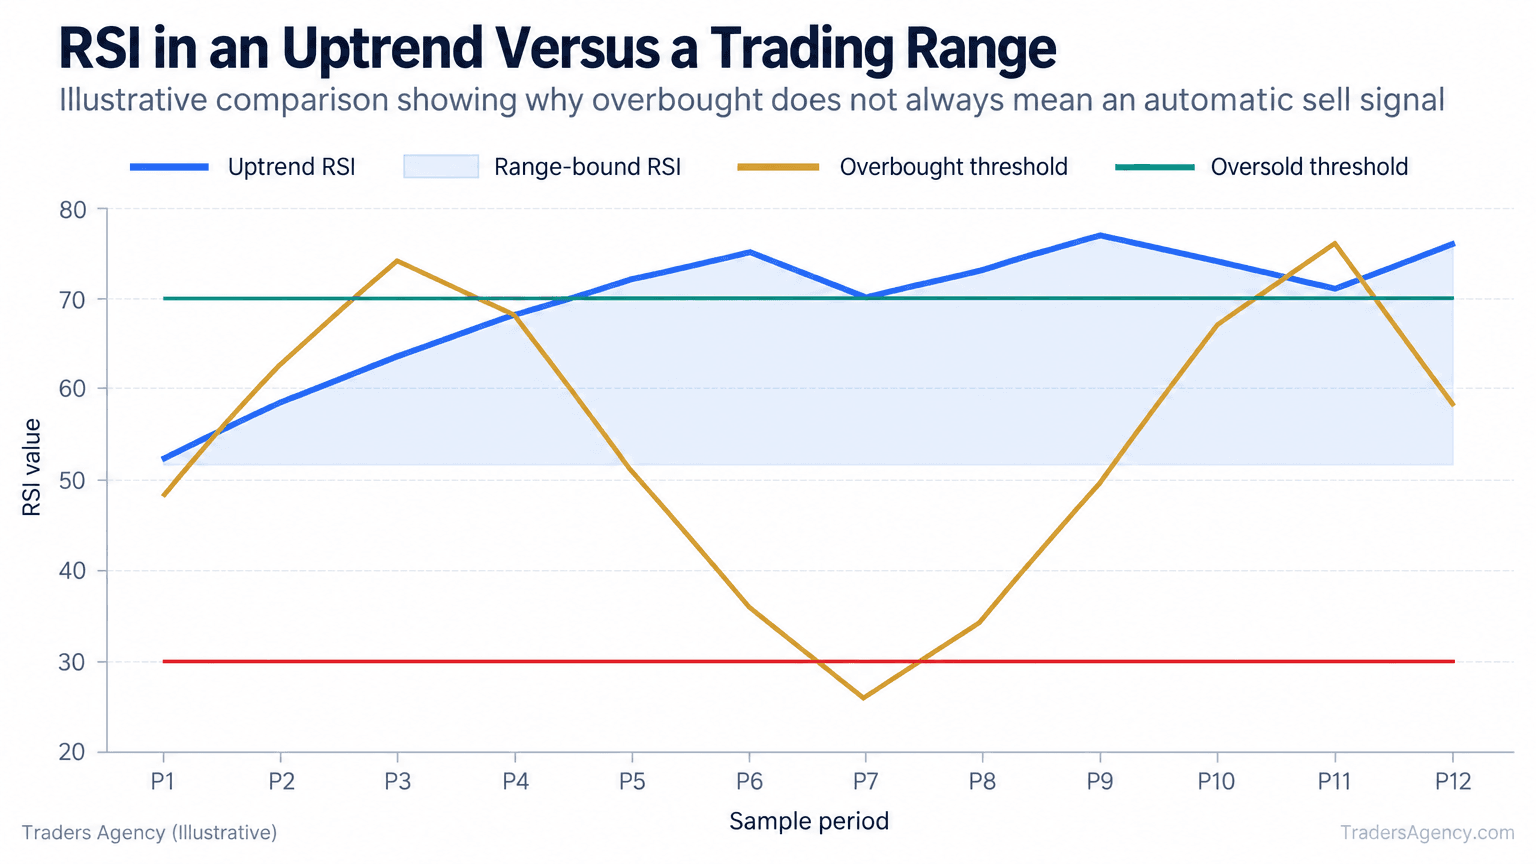
This distinction matters a lot for how we build an RSI strategy. In a ranging, sideways market, the classic 70/30 overbought and oversold approach tends to work well because price keeps bouncing between predictable boundaries. In a trending market, that same approach generates false signals repeatedly, because RSI can sit in extreme territory for long stretches while the trend simply continues.
A quick way to check which environment you're in: look at a longer moving average, like the 50-period, on the same chart. If price is consistently above a rising 50-period average, you're likely in an uptrend, and RSI dips toward 40-50 are often buying opportunities rather than sell signals.
Bullish and Bearish Divergence
Divergence happens when price and RSI disagree with each other, and it's one of the more reliable signals the indicator offers. Bullish divergence occurs when price makes a lower low, but RSI makes a higher low, suggesting selling momentum is fading even as price drops. Bearish divergence occurs when price makes a higher high, but RSI makes a lower high, suggesting buying momentum is fading even as price rises.
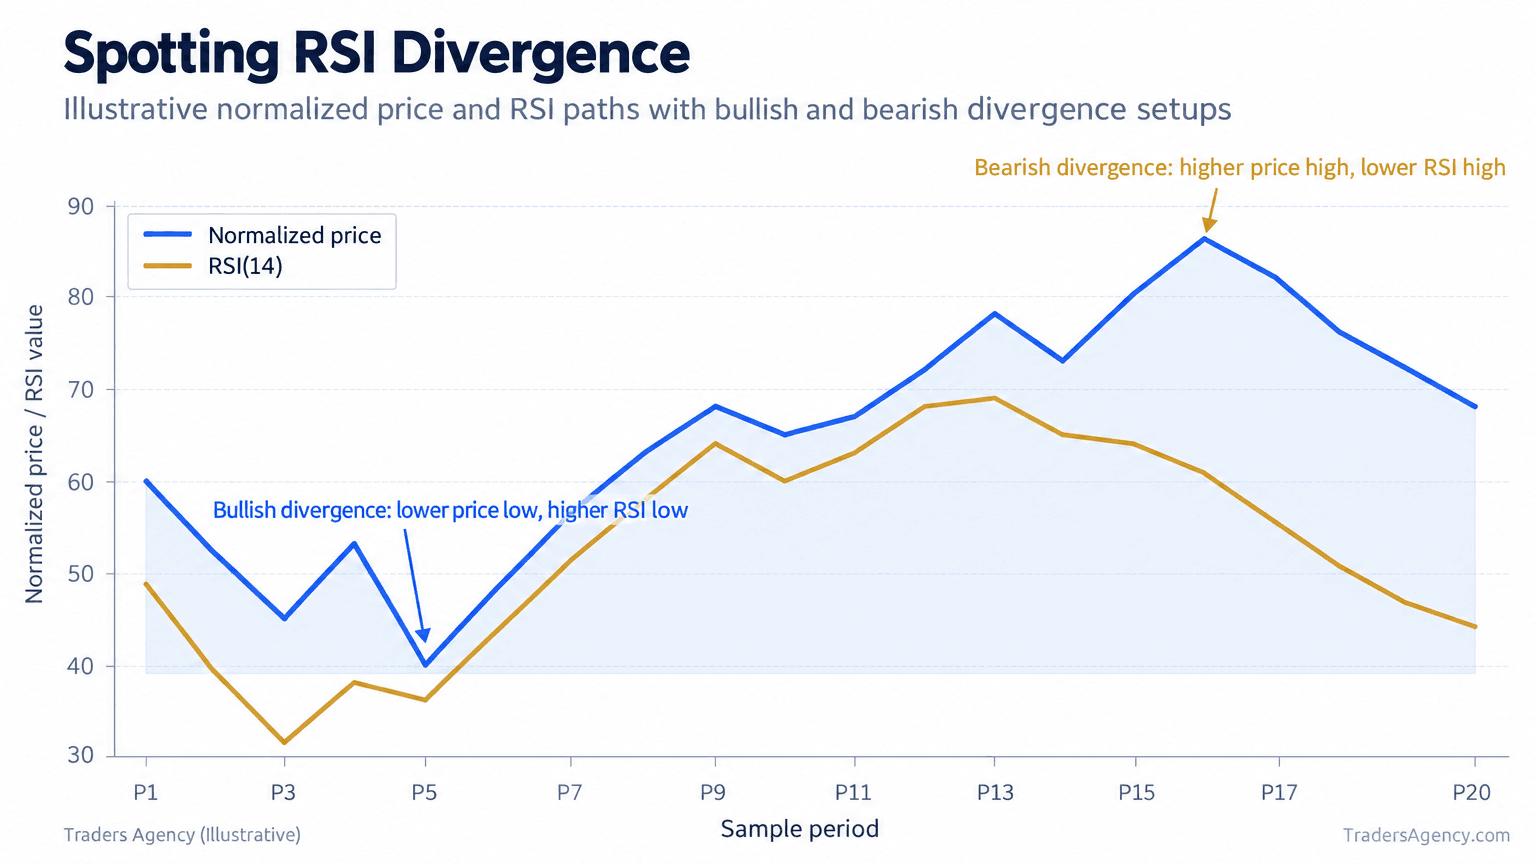
Here's a concrete setup we'd watch for: a stock drops from $50 to $45, with RSI hitting 22 on the first low. A few sessions later, price drops again to $43, a new low, but this time RSI only falls to 28, a higher low than before. That gap between price and RSI is bullish divergence.
| Event | Price | RSI Reading |
|---|---|---|
| First Low | $45 | 22 |
| Second Low (new low) | $43 | 28 (higher low) |
Divergence doesn't guarantee a reversal, but it's a meaningful warning that downward momentum is weakening. We typically use it alongside a support level or candlestick pattern as a confirmation trigger before entering a trade.
How Do You Adjust RSI Settings?
The default 14-period setting works well for most swing traders and is the standard most trading platforms ship with out of the box. It also appears alongside other common studies in free education material published by exchanges such as the CBOE. But the setting isn't fixed in stone.
For day trading, many active traders shorten the period to 9 or 7 on shorter timeframes like 5-minute or 15-minute charts. A shorter period makes RSI more sensitive, generating more signals but also more noise. Swing traders holding positions for days or weeks often stick with 14, or even lengthen it to 21 for smoother, less reactive readings.
On TradingView, adjusting the setting takes seconds: open the RSI indicator settings panel, change the "length" input from 14 to your preferred number, and the line recalculates instantly across your chart history. We recommend testing different settings on historical charts before applying them to live trades, so you can see how sensitivity changes without risking capital.
Which Indicators Work Best Alongside RSI?
RSI works best when paired with a tool that confirms trend direction, since RSI alone can't tell you whether you're in a trending or ranging market. Moving averages, MACD, and volume are the three most common companions we use alongside RSI for stronger confirmation.
- Moving averages (50-period or 200-period): help confirm the broader trend direction before acting on an RSI signal.
- MACD (Moving Average Convergence Divergence): another momentum tool that can confirm RSI divergence signals with its own crossover patterns.
- Volume: a spike in volume alongside an RSI reversal signal adds conviction that real buying or selling pressure is behind the move.
- Support and resistance levels: combining horizontal price levels with RSI extremes gives you a specific price zone to act on, rather than just a number.
This layered approach is really the foundation of how we build an RSI strategy. No single indicator should carry the full weight of a trade decision, and RSI is no exception.
When Should You Use RSI, and When Should You Avoid It?
RSI tends to perform best in range-bound markets, where price oscillates between clear support and resistance zones. It also works well on daily and 4-hour charts for swing trading, where noise is lower than on very short timeframes.
Avoid relying on RSI alone during strong, sustained trends, major news events, or earnings releases, when price can gap and momentum can stay extreme for long periods regardless of what RSI shows. It's also worth being cautious around low-volume or illiquid assets, where price swings can distort the indicator's readings.
Risk Management Basics
- Never size a position based on an RSI reading alone, treat it as one input among several.
- Use a stop loss below recent support (for long trades) or above recent resistance (for short trades), not an arbitrary dollar amount.
- Limit any single trade based on an RSI signal to a small percentage of your total account, as you would with any technical setup.
- Backtest your specific RSI settings and rules on historical charts before trading them live.
Key Concept: RSI shines in sideways, range-bound markets. In strong trends, lean on trend-confirmation tools like moving averages instead of fighting the RSI reading.
FAQ: Using RSI in Your Trading
What is RSI and how do you use it?
RSI is a momentum indicator measuring the speed and magnitude of price changes on a 0-100 scale. We use it by watching for overbought (above 70) and oversold (below 30) readings, then confirming those signals with trend direction, support/resistance, or other indicators before trading.
How do you use RSI effectively?
There's no perfect use of RSI, but the most reliable approach combines RSI extremes or divergence with confirmation from price action, trend context, and volume, rather than trading the RSI line in isolation.
What is a good RSI level to buy?
A reading below 30 that curls back upward, especially near a known support level and in an uptrend, is generally considered a stronger buy signal than a simple touch of 30.
Which indicator goes best with RSI?
Moving averages and MACD are commonly paired with RSI because they help confirm trend direction and momentum, reducing the false signals RSI can generate on its own.
Can RSI be used for day trading?
Yes, many day traders shorten the RSI period to 7 or 9 on 5-minute or 15-minute charts for faster signals, though this also increases the number of false readings.
Want expert trading insights delivered daily?
Join thousands of traders who rely on Traders Agency for market analysis and trade ideas.
Join Traders AgencyDISCLAIMER: Traders Agency does not offer financial advice. The information provided is for educational purposes only and should not be considered financial advice. Traders Agency is not responsible for any financial losses or consequences resulting from the use of the information provided. Trading carries inherent risks and may not be suitable for all individuals. You are advised to conduct your own research and seek personalized advice before making any investment decisions, recognizing the potential risks and rewards involved.
See more from Traders Agency on Google
Make us a preferred source and our market analysis will appear more prominently in your Google Search, Top Stories, and AI results.
Add to Preferred Sources