
Hey, Ross here:
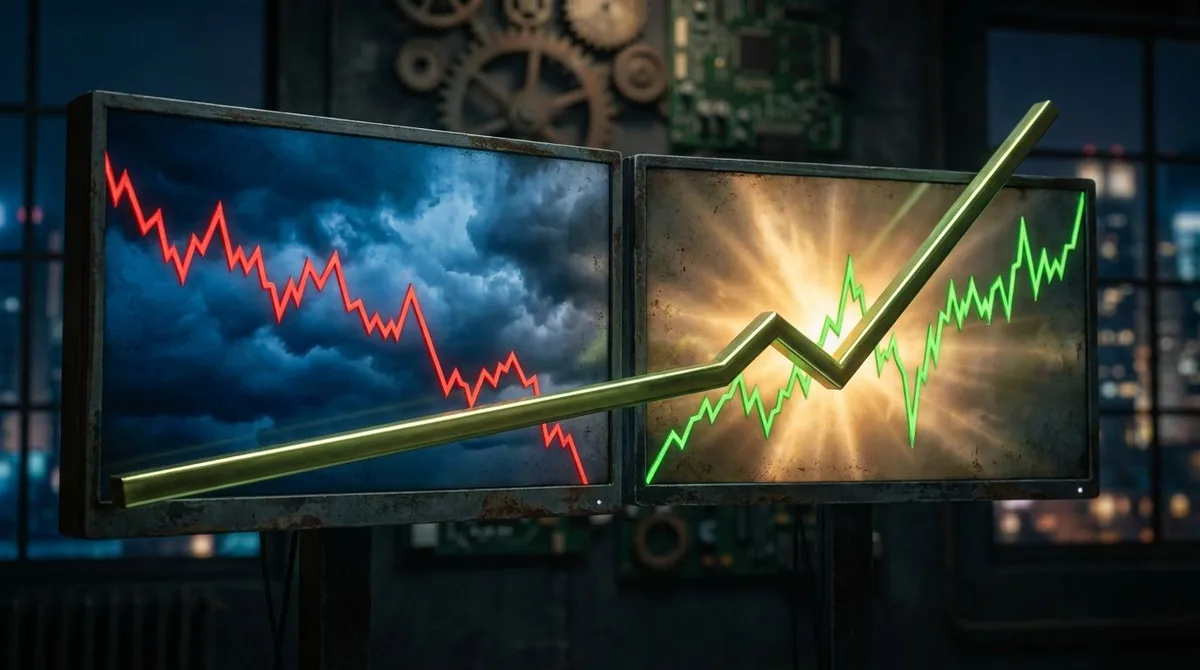
A lot of stocks are getting smoked.
But the money hasn’t disappeared.
It’s just showing up somewhere else.
Take a look:
Chart of the Day
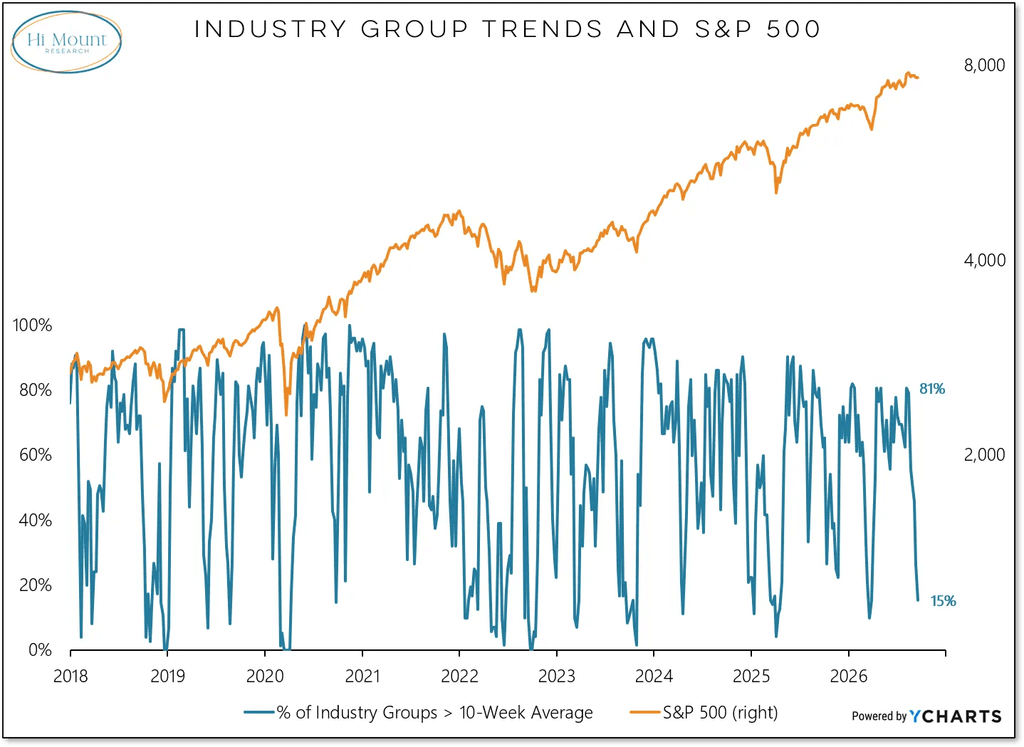
This chart tracks the percentage of industry groups trading above their 10-week moving average.
A few weeks ago, that number was around 80%.
Today? Just 15%.
That is a massive collapse in participation.
Most industry groups simply aren’t acting well right now.
You can see the same thing when you zoom in on individual stocks.
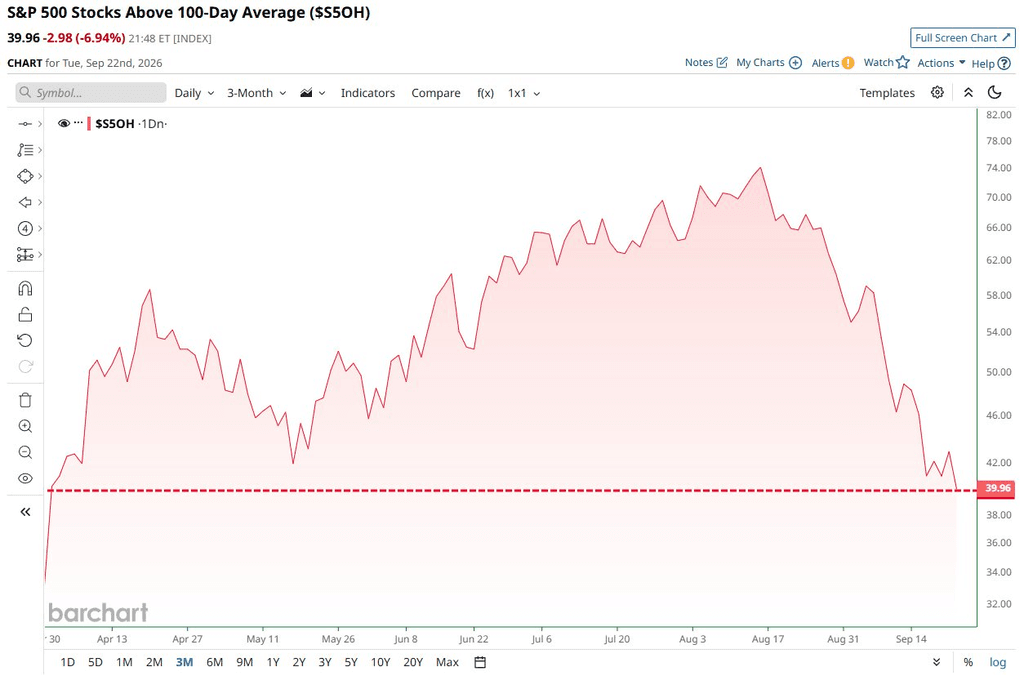
Only about 40% of S&P 500 stocks are still above their 100-day moving average.
Which means roughly 60% are below it.
So underneath the headline indexes, there’s been a lot more damage than most people probably realize.
But then you get this:
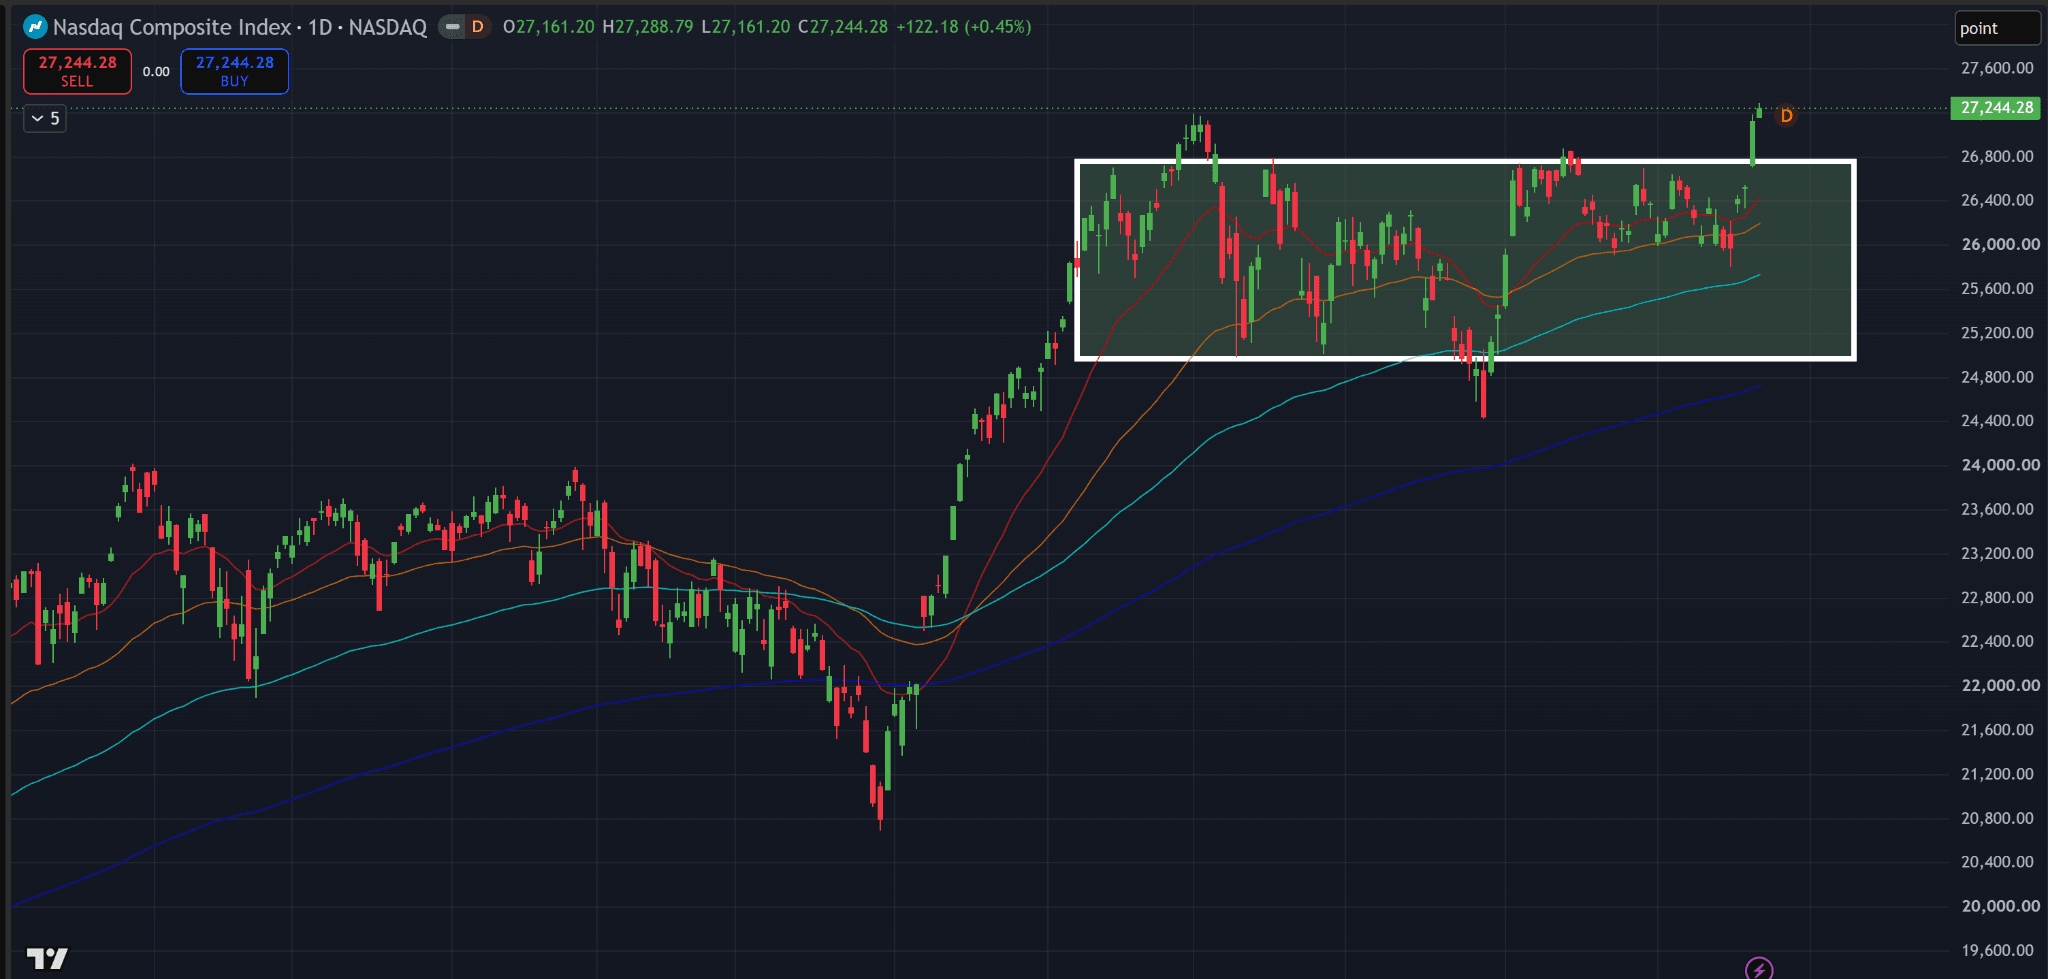
After spending roughly three and a half months chopping sideways, the Nasdaq just broke out to new all-time highs.
And semiconductors are joining in.
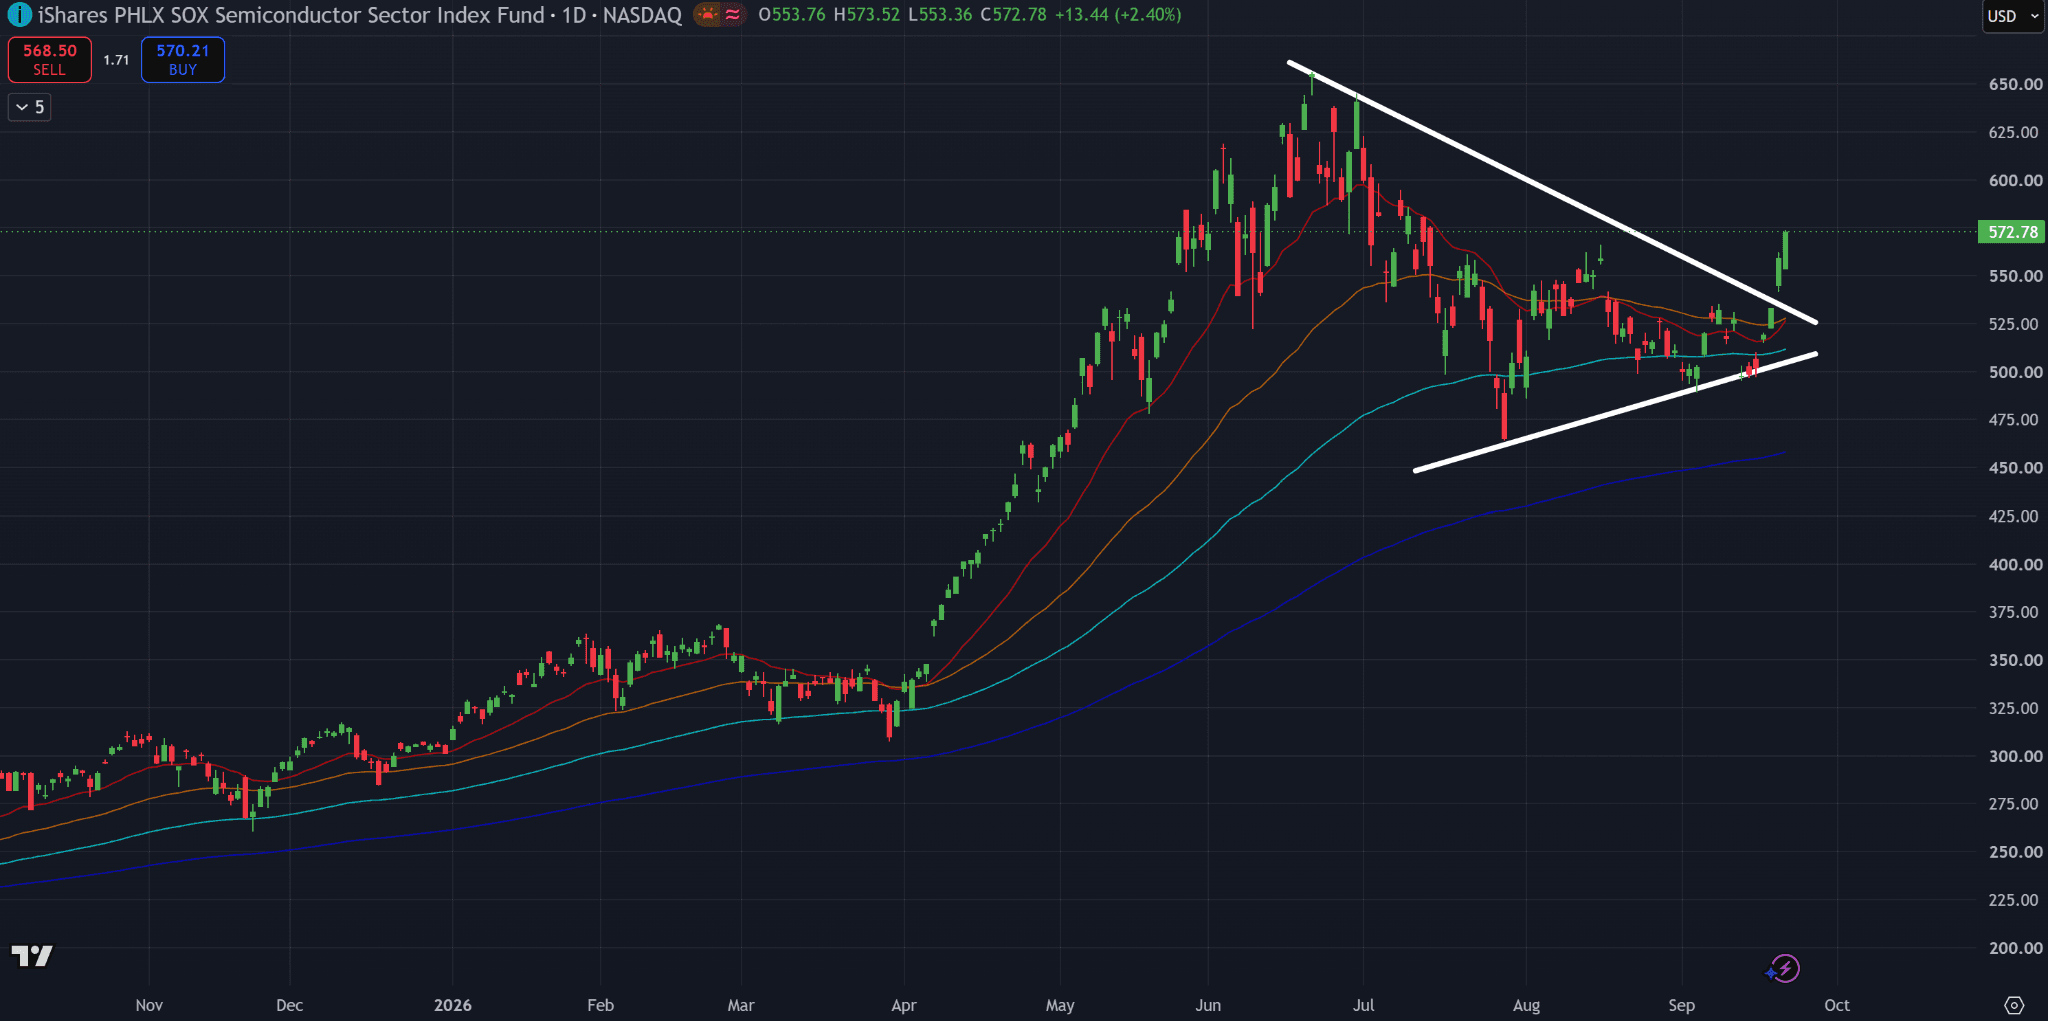
The Semiconductor ETF has also just broken out of a tight multi-month coil…
And so has the Memory ETF.
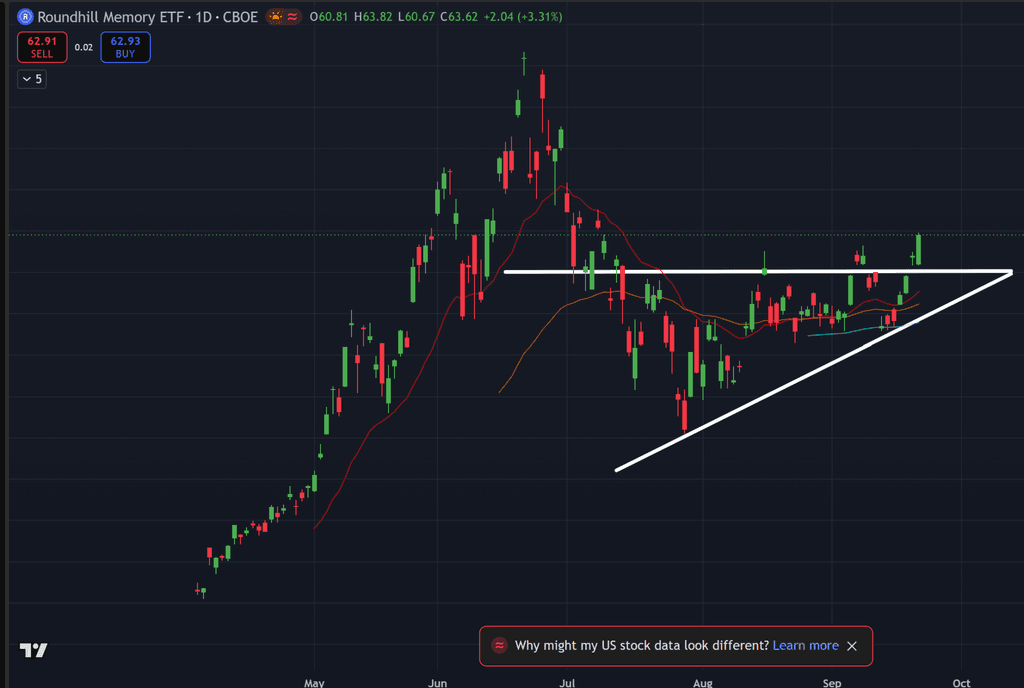
So we’ve got two completely different markets happening at the same time.
Most industry groups are struggling.
A majority of S&P 500 stocks are below their 100-day trend.
In other words, there are a lot of breakdowns happening…
Like the Utility sector falling to 52-week lows.
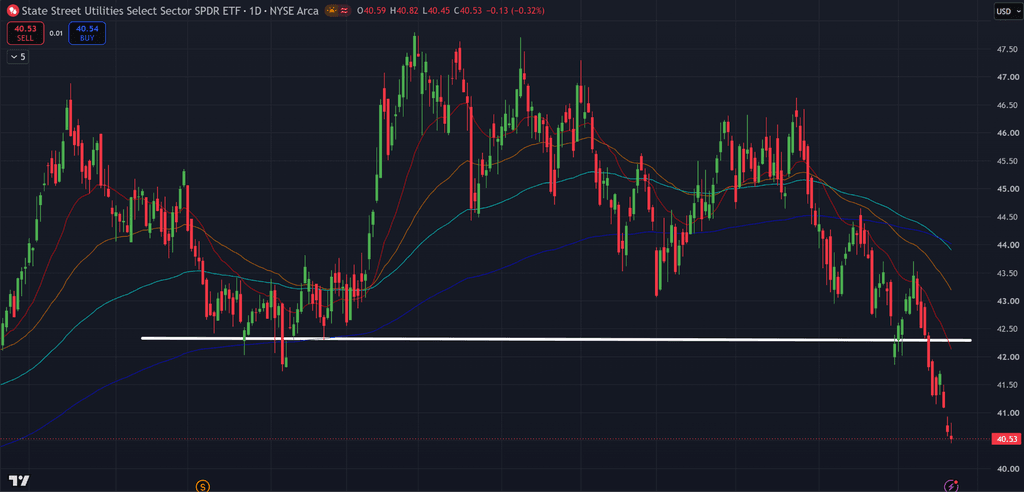
Yet, at the same time, some of the market’s biggest leadership areas are breaking higher.
And this split can lead to some lucrative opportunities.
I explain below.
Insight of the Day
Scarce breakouts can quickly turn explosive.
When almost everything is going up, traders have choices everywhere.
A dozen sectors look good.
Hundreds of stocks are breaking resistance.
Capital gets spread around.
That’s not what we have right now.
Strength is getting harder to find.
And when only a small group of stocks is actually working, traders naturally start crowding into the few places where the momentum still exists.
That can pour a lot of buying power into a surprisingly small number of names.
So when one of those stocks finally clears resistance…
The move can get big in a hurry.
That’s why I’m paying very close attention to breakouts right now.
And later today at 3 p.m. Eastern…
We’re going LIVE to show you the chart pattern we use to hunt for exactly those kinds of moves.
It’s a pattern favored by some of the best traders in the world, including multiple U.S. investing champions…
And it has appeared before moves like 163% in seven weeks… 177% in 11 days… and 148% in just two days.
We’ll also break down some of the top stock setups on our radar right now…
And show you how to recognize this pattern for yourself.
Click here to secure your free seat for today’s LIVE training if you haven’t yet…
And we’ll see you at 3 p.m. ET.
P.S. If you’re planning to attend on a mobile device, make sure you download the presentation app now so you don’t miss anything when it starts. See you there.
iOS: https://apps.apple.com/us/app/goto/id1465614785
Android: https://play.google.com/store/search?q=goto&c=apps
Customer Story of the Day
“I have made thousands of dollars based on Ross’s recommendations over the last couple of months.
And his supporting cast at Traders Agency is amazing.
You will not go wrong with this team.”

Ross Givens
Editor, Stock Surge Daily
See more from Traders Agency on Google
Make us a preferred source and our market analysis will appear more prominently in your Google Search, Top Stories, and AI results.
Add to Preferred Sources