
The price to earnings ratio (P/E ratio) compares a company's share price to its earnings per share, showing you exactly how much investors are paying for each dollar of profit. We teach this metric early to new members because it takes seconds to calculate and gives you a fast read on whether a stock looks expensive or cheap relative to what it actually earns. By the end of this guide, you'll know how to calculate it, what counts as a "good" number, and where this metric quietly fails.
You've probably seen a stock described as "trading at 25 times earnings" and wondered what that really means for your decision to buy or walk away. That single number carries a lot of information, but only once you understand what's driving it. We'll walk you through the formula, a worked example with real numbers, and the mistakes we see beginners make when they lean on this metric by itself.
What Is the P/E Ratio?
Bottom Line: The P/E ratio is a quick first filter, not a final verdict: it tells you what investors are paying per dollar of earnings, but a high or low number only makes sense once you ask why it's there. Pair it with growth expectations and industry context, since a cheap-looking P/E can just as easily signal a declining business as a bargain.
The P/E ratio measures how much the market is willing to pay for one dollar of a company's annual earnings. A higher ratio generally means investors expect faster growth. A lower ratio often signals a more mature business, or one the market has written off.
Think of it like buying a rental property based on its annual rental income. If a property costs $200,000 and generates $10,000 a year, you're paying 20 times its annual income. Stocks work the same way, except the "rent" is the company's profit, called earnings per share, or EPS.
Key Concept: The P/E ratio doesn't tell you whether a stock is good or bad on its own. It tells you what price you're paying relative to the profit the company produces, which only becomes useful when you compare it to something else: the stock's own history, its industry peers, or the broader market.
How Do You Calculate the P/E Ratio?
You calculate the price to earnings ratio by dividing a company's current share price by its earnings per share. Both numbers are easy to find on any financial data site or broker platform, and most trading platforms display the P/E ratio automatically right next to the stock quote.
Price to Earnings Ratio Formula Explained
The formula is straightforward:
P/E Ratio = Share Price ÷ Earnings Per Share (EPS)
EPS is itself calculated as a company's net income divided by its total number of outstanding shares. You'll find both net income and share count in a company's quarterly or annual report, filed with the SEC and publicly available through EDGAR.
Here's how the ratio responds when the inputs move:
- Share price rises, EPS stays flat – the P/E ratio goes up
- EPS rises, share price stays flat – the P/E ratio goes down
- Both rise at the same rate – the P/E ratio stays the same
- EPS turns negative – the P/E ratio becomes negative, or is more often reported as "N/A"
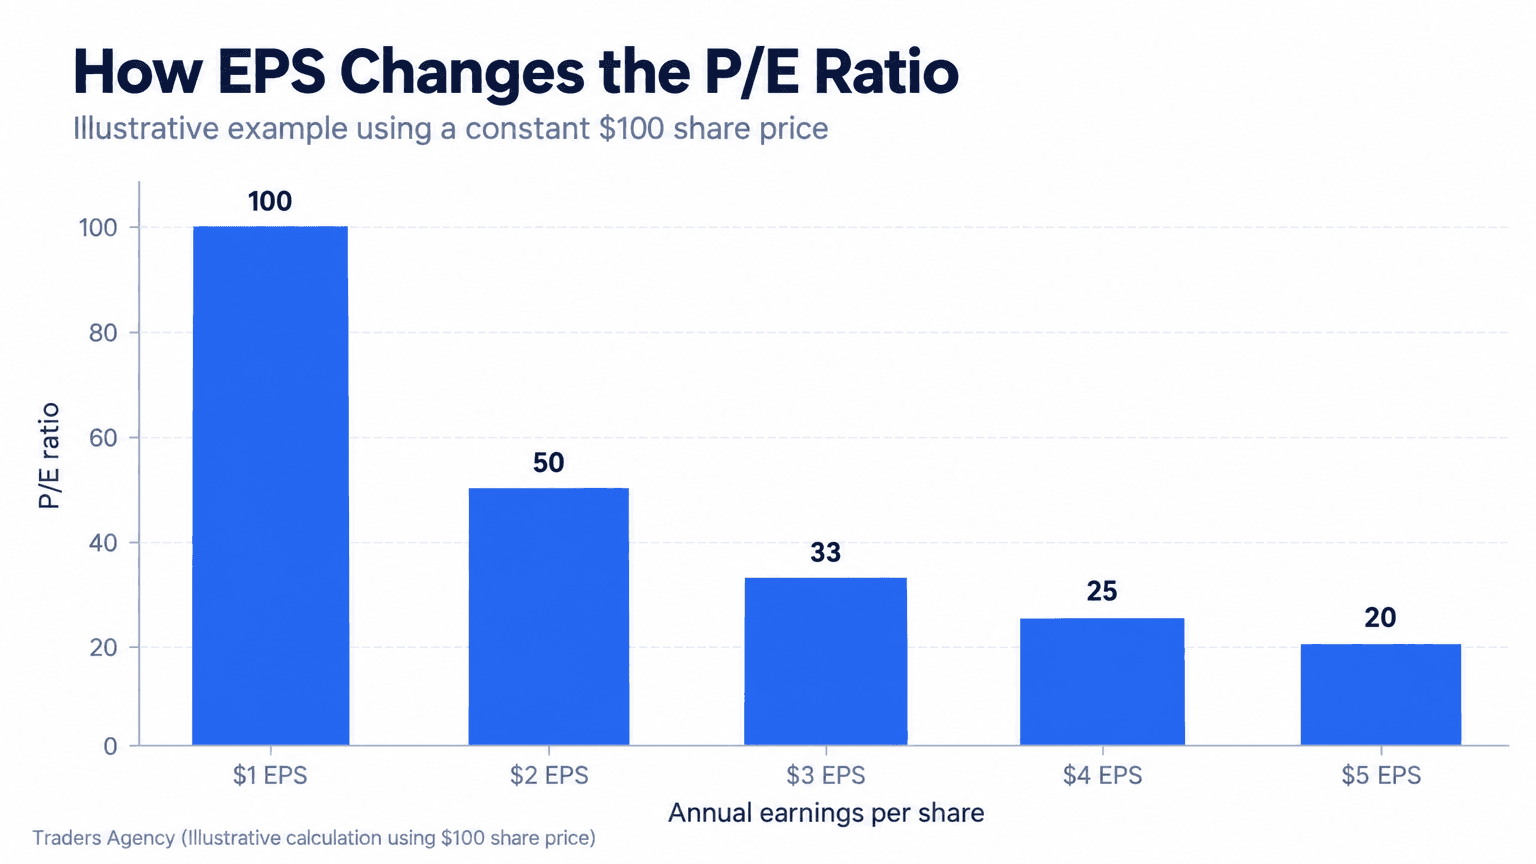
Notice how the same $100 share price produces wildly different ratios depending on earnings. This is exactly why you can never judge a P/E number without context.
If you'd rather skip the manual math, most brokerage platforms and finance sites offer a free price to earnings ratio calculator. You enter the ticker and it pulls the current price and most recent EPS automatically.
What's the difference between trailing P/E and forward P/E?
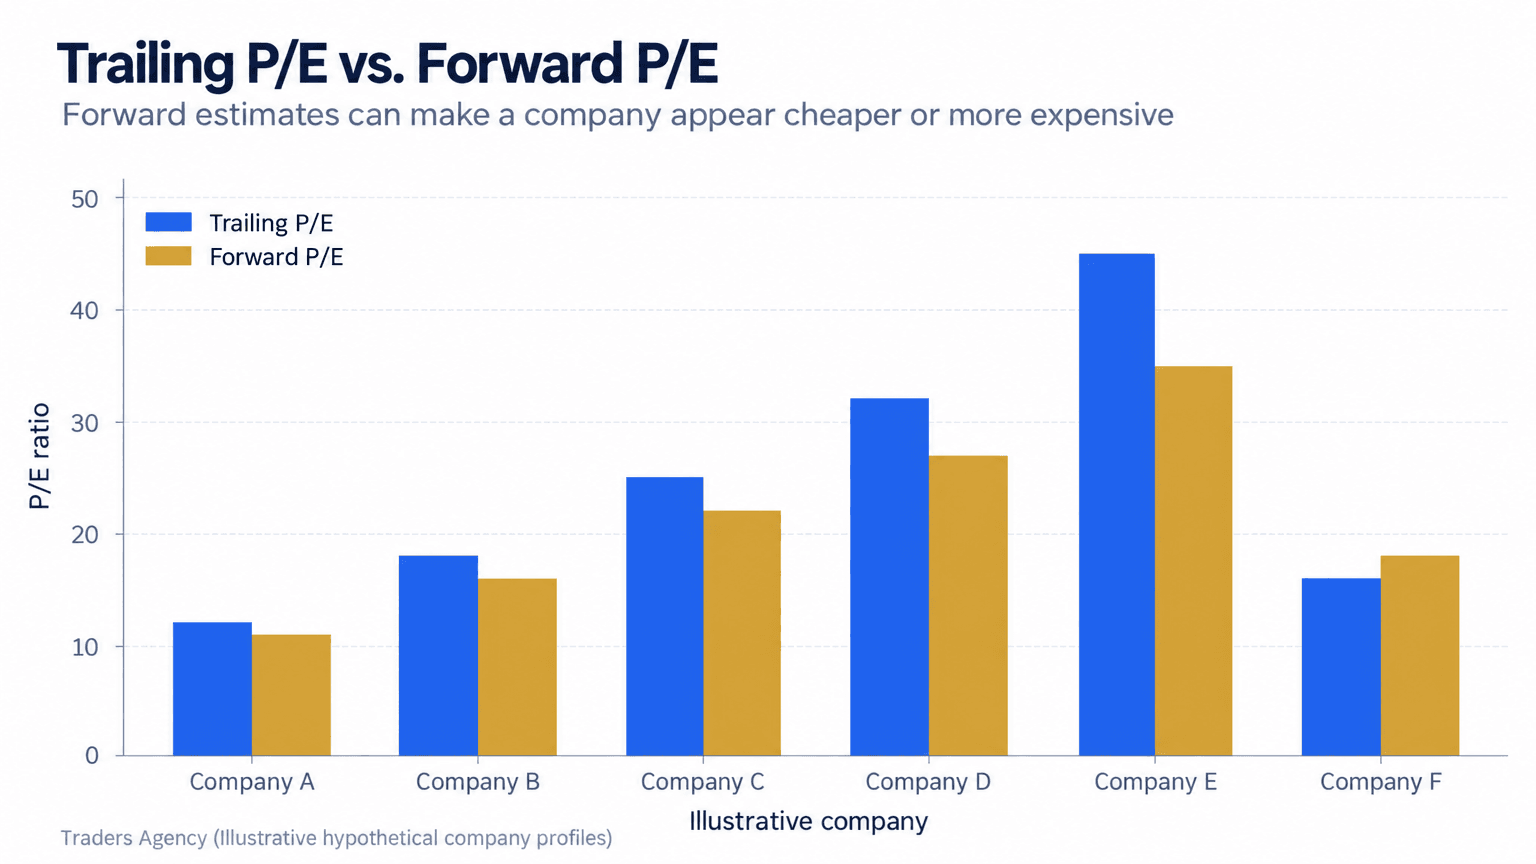
There are two main versions of this ratio, and mixing them up is a fast track to confusion. Trailing P/E uses the last 12 months of actual reported earnings. Forward P/E uses analyst estimates for the next 12 months of earnings.
| Version | Earnings Used | Strength | Weakness |
|---|---|---|---|
| Trailing P/E | Last 12 months, reported | Based on facts that already happened | Backward-looking |
| Forward P/E | Next 12 months, estimated | Shows where the business is headed | Estimates are frequently wrong |
A stock can look expensive on a trailing basis and cheap on a forward basis if earnings are expected to grow quickly. That gap matters enormously for growth stocks, where current profits are small but future profits are projected to expand fast.
Want expert trading insights delivered daily?
Join thousands of traders who rely on Traders Agency for market analysis and trade ideas.
Join Traders AgencyWhat Is a Good PE Ratio?
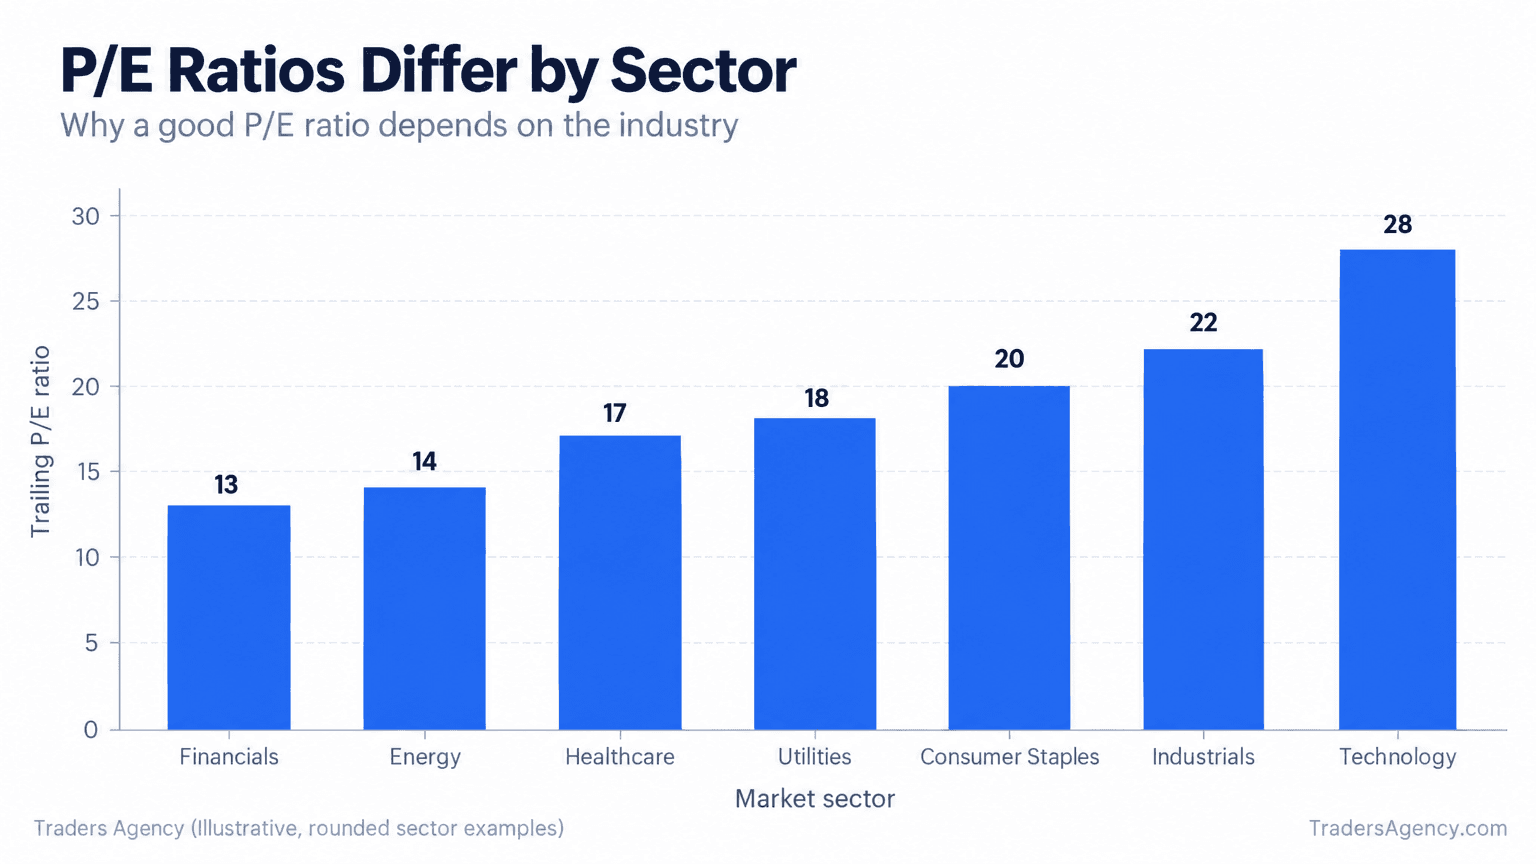
A good P/E ratio depends entirely on the sector, the company's growth rate, and the market environment at the time. There's no single number that applies to every stock, which is why we insist on comparing a ratio within its own industry first.
As a rough historical anchor, the price to earnings ratio for the S&P 500 has averaged somewhere in the high teens to low twenties over long stretches, though it has traded well above and well below that range during different market cycles. Utility and financial companies, which grow slowly but reliably, often trade at lower multiples, typically in the 10 to 15 range. Technology and consumer growth companies, where investors expect faster expansion, often trade at higher multiples, sometimes 25 to 35 or more.
Is 40 a Good PE Ratio?
A P/E ratio of 40 can be perfectly reasonable for a fast-growing technology or biotech company, but it would be stretched for a slow-growing utility or bank. Context, specifically the company's growth rate and its sector norm, determines whether 40 is a red flag or a fair price for growth.
What Does a 30 PE Ratio Mean?
A 30 P/E ratio means investors are paying $30 for every $1 of annual earnings that company produces. It signals that the market expects above-average growth, since paying 30 times earnings only makes sense if profits are set to climb meaningfully in the coming years.
What Did Warren Buffett Say About PE Ratio?
Buffett has long emphasized that a low P/E ratio alone doesn't make a stock cheap, and a high one doesn't automatically make it expensive. His approach centers on buying quality businesses at a fair price, treating the P/E ratio as one input alongside profitability, debt levels, and competitive position, never as a standalone decision tool. That's the same way we frame it for our members.
Price-to-Earnings Ratio Example
Here's a concrete price-to-earnings ratio example using simple numbers you can follow step by step.
- Step 1: Pull the share price – The stock trades at $60 per share.
- Step 2: Pull trailing EPS – Over the last four quarters, the company earned $3.00 per share.
- Step 3: Divide – $60 ÷ $3.00 = 20. The stock trades at 20 times trailing earnings.
- Step 4: Check the forward number – If analysts expect next year's EPS to reach $4.00 and the price holds at $60, the forward P/E drops to 15. The stock looks cheaper on a forward basis even though the price never moved.
Now compare that to a competitor trading at $45 with EPS of $1.00:
| Metric | Company A | Company B |
|---|---|---|
| Share Price | $60 | $45 |
| Trailing EPS | $3.00 | $1.00 |
| Trailing P/E | 20 | 45 |
| Earnings Growth Rate | 8% per year | 40% per year |
| Approximate PEG Ratio | 2.5 | 1.1 |
On the surface, Company B looks far more expensive at 45 times earnings. But if it's compounding earnings at 40% a year while Company A grows at 8%, the higher multiple may be entirely justified. This is where the PEG ratio (P/E divided by the expected earnings growth rate) earns its place in your process. A PEG near 1.0 suggests the price is reasonably matched to growth, while a PEG well above 2.0 suggests you may be overpaying for that growth.
What are the limitations of the P/E ratio?
The P/E ratio breaks down in a handful of common situations, and every beginner should know them before relying on this metric.
- Negative earnings: If a company loses money, EPS is negative, and the price-to-earnings ratio negative result carries no useful meaning. Most platforms simply display "N/A" instead of a number.
- Cyclical companies: Businesses tied to commodity prices or the economic cycle (airlines, automakers, miners) can show artificially low P/E ratios at the peak of their earnings cycle and artificially high ones during a downturn.
- Accounting differences: One-time gains, write-offs, or unusual accounting items can distort EPS for a single quarter and throw the ratio off temporarily.
- No growth context on its own: A low P/E isn't automatically cheap and a high P/E isn't automatically expensive without comparing growth, debt, and sector norms.
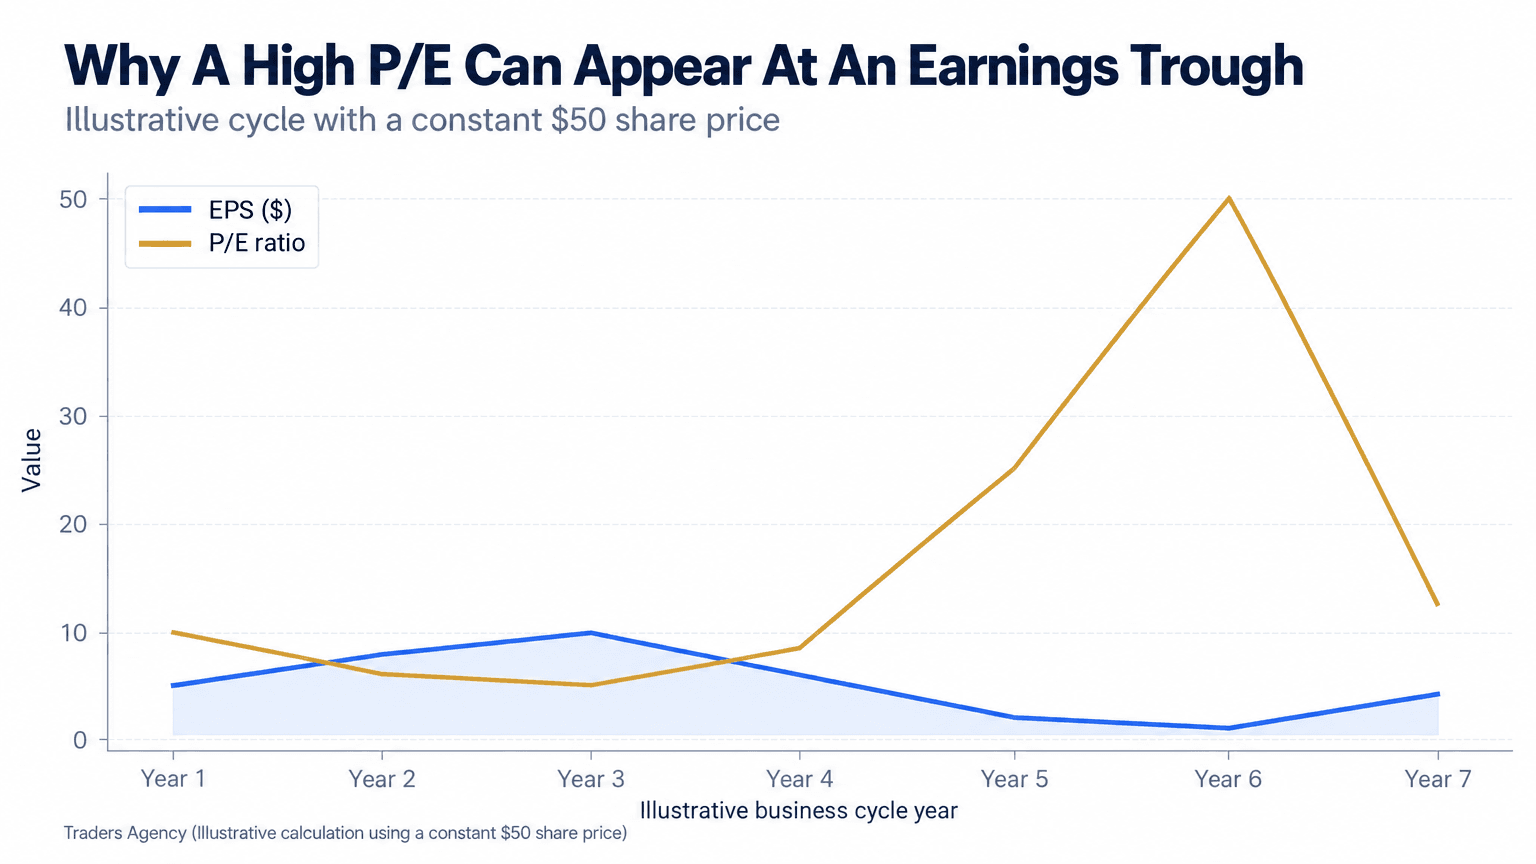
Watch Out: In the chart above, the share price never changes, yet the ratio swings wildly simply because earnings rose and fell. That's the cyclical trap. A stock that looks "cheap" at the top of an earnings cycle may actually be at its most expensive on a normalized basis.
How do you use the P/E ratio in practice?
We never recommend trading or investing off a single number, and the price to earnings ratio is no exception. Here's the checklist our team runs before the ratio influences any decision:
- Compare to its own history – Measure the current P/E against the stock's 5-year average, not just today's snapshot.
- Compare to direct peers – Use competitors in the same sector as the benchmark, not the broad market.
- Add the PEG ratio – Especially when evaluating growth stocks where high multiples are the norm.
- Test for cyclicality – Check whether earnings swing with the economic cycle before trusting the current number.
- Verify the EPS source – Confirm the figure comes from a recent filing, since stale data quietly skews the ratio.
Common Mistake: Beginners screen for "low P/E" stocks and assume they've found bargains. Sometimes a low P/E simply reflects a business in decline, not hidden value. Always ask why the ratio sits where it does before acting on it.
Want expert trading insights delivered daily?
Join thousands of traders who rely on Traders Agency for market analysis and trade ideas.
Join Traders AgencyDISCLAIMER: Traders Agency does not offer financial advice. The information provided is for educational purposes only and should not be considered financial advice. Traders Agency is not responsible for any financial losses or consequences resulting from the use of the information provided. Trading carries inherent risks and may not be suitable for all individuals. You are advised to conduct your own research and seek personalized advice before making any investment decisions, recognizing the potential risks and rewards involved.
See more from Traders Agency on Google
Make us a preferred source and our market analysis will appear more prominently in your Google Search, Top Stories, and AI results.
Add to Preferred Sources