
RSI and MACD divergence trading is a technical analysis method where we compare price action against momentum indicators to spot potential reversals or trend continuations before they fully play out. When price and an indicator like the Relative Strength Index (RSI) or Moving Average Convergence Divergence (MACD) move in opposite directions, that disagreement often signals weakening momentum. We teach our members to use this gap between price and indicator behavior as an early warning sign to plan entries, exits, or tighten risk on existing positions.
You've probably seen this happen: a stock keeps pushing to new highs, everyone on your feed is celebrating, and then out of nowhere the price drops hard. If you'd been watching your RSI or MACD indicator, there's a decent chance you would have seen the warning sign days in advance.
This article walks through how RSI and MACD divergence trading actually works, how to tell regular divergence apart from hidden divergence, and how to confirm signals across timeframes so you're not getting faked out by every minor wiggle. By the end, you'll know how to spot divergence on a chart, read it correctly, and decide when it's worth acting on versus when it's just noise.
What Is RSI MACD Divergence Trading?
Bottom Line: Divergence between price and RSI or MACD is a warning sign, not a trade trigger on its own. Confirming signals across both indicators and checking a higher timeframe before acting cuts down on false positives and prevents getting faked out by minor wiggles.
RSI MACD divergence trading is a strategy where we compare the direction of price swings to the direction of the RSI and MACD indicators, looking for disagreement between the two. When price makes a new high or low but the indicator doesn't confirm it, that's divergence, and it often precedes a shift in momentum.
The logic behind this is simple once you see it. Price measures where the asset actually is, but RSI and MACD measure the strength behind the move that got it there. If a stock hits a new high but the buying pressure behind that high is actually weaker than the pressure behind the previous high, that's a red flag that the rally is running out of gas even though the price chart still looks strong.
Think of it like a car running out of gas while still cruising at highway speed. The car is still moving fast, that's your price action. The engine isn't producing the same power it was ten minutes ago, that's your momentum indicator. Eventually the car slows down even if nothing about the road has changed.
Regular Divergence vs Hidden Divergence
These two setups get confused constantly, and mixing them up is one of the fastest ways to lose money with this strategy.
- Regular bullish divergence: Price makes a lower low, RSI or MACD makes a higher low. Signals a possible reversal from down to up.
- Regular bearish divergence: Price makes a higher high, RSI or MACD makes a lower high. Signals a possible reversal from up to down.
- Hidden bullish divergence: Price makes a higher low, RSI or MACD makes a lower low. Signals trend continuation inside an uptrend.
- Hidden bearish divergence: Price makes a lower high, RSI or MACD makes a higher high. Signals trend continuation inside a downtrend.
Key Concept: Regular divergence is a reversal signal. Hidden divergence is a continuation signal. That distinction alone separates traders who use this tool well from traders who get chopped up by it.
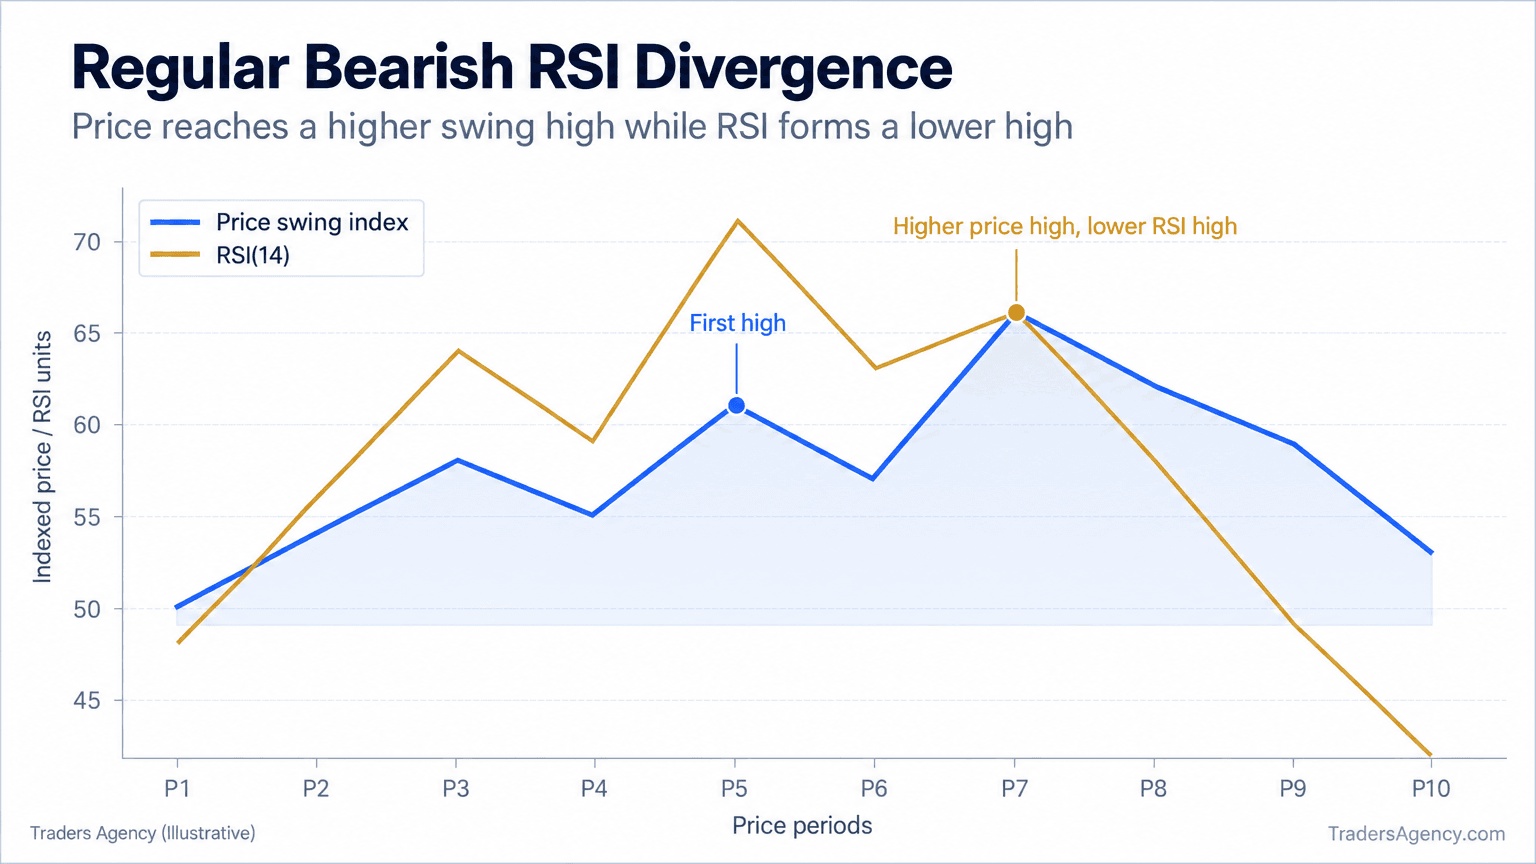
How Do You Identify Regular vs Hidden Divergence on a Chart?
Spotting these setups on a live chart is a different skill than recognizing the definitions on paper. Here's the process we walk our members through.
- Step 1: Mark the swing points. Identify two consecutive swing highs or swing lows on the price chart. You need at least two points to compare, no exceptions.
- Step 2: Draw a trendline connecting those points on price. Then draw the same trendline on your RSI or MACD window, connecting the corresponding peaks or troughs.
- Step 3: Compare the slopes. If the two trendlines slope in opposite directions, you have divergence. If they slope the same direction, there's no signal, move on.
- Step 4: Classify it correctly. Use the four categories above to determine whether you're looking at a potential reversal (regular) or a potential continuation (hidden).
A common mistake here is forcing divergence onto a chart that doesn't clearly have it. If you have to squint or redraw your swing points three times to make it fit, it probably isn't a clean signal.
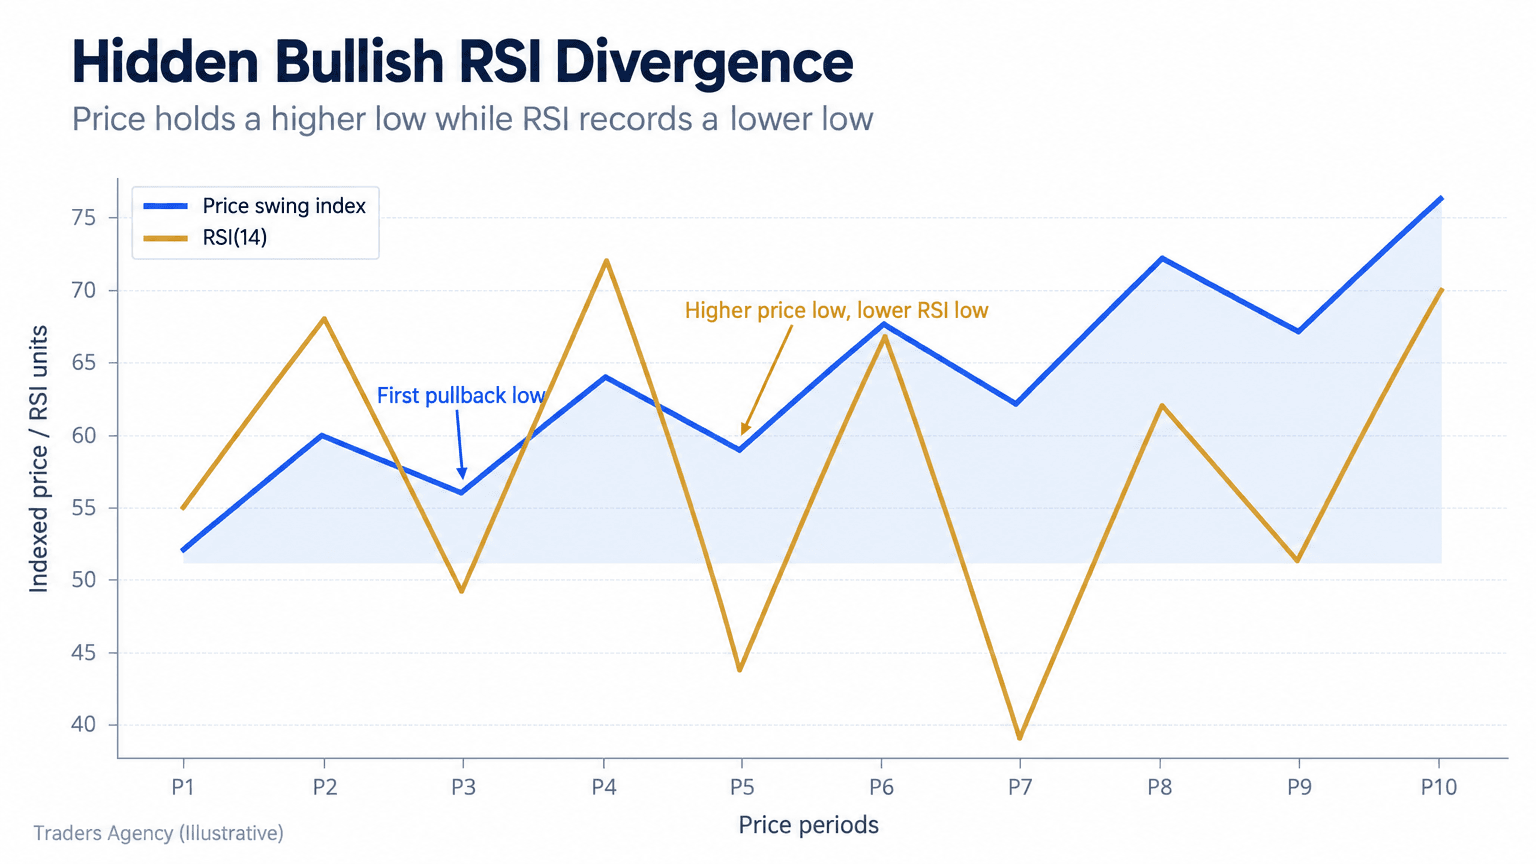
Reading MACD Histogram Divergence Signals
The MACD histogram gives you a slightly different read than the RSI line, and we find it useful as a secondary confirmation rather than a standalone signal.
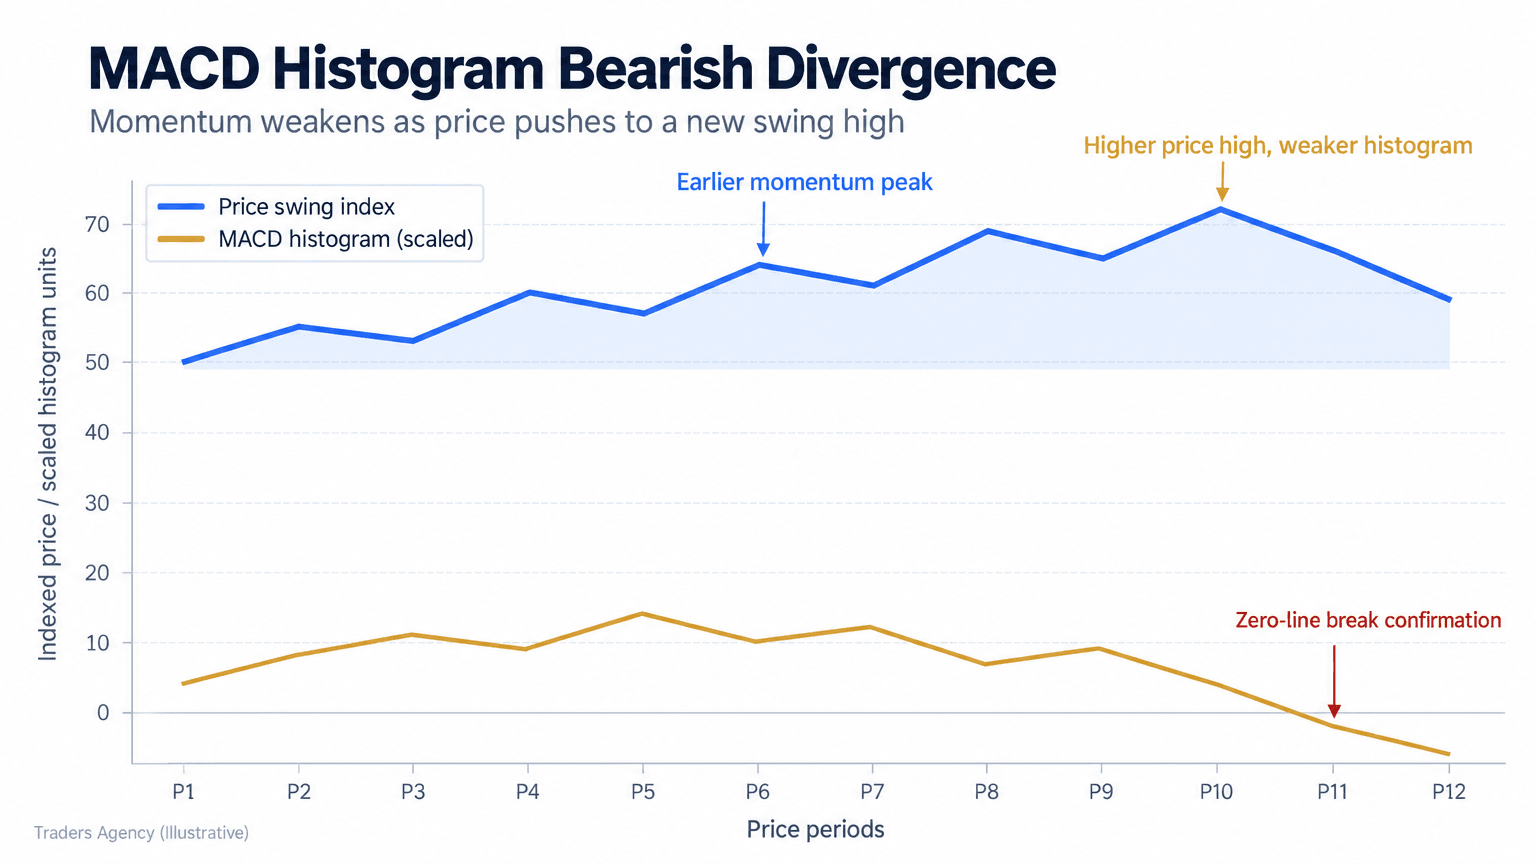
Here's a concrete setup we use when teaching this concept. A stock rallies from $48 to $55 over three weeks, then pulls back and rallies again to $58, a new high. If the MACD histogram peak during the first rally hit 1.2 and the peak during the second rally only reached 0.7, that's bearish MACD histogram divergence. Price made a higher high, but the histogram made a lower peak, meaning the momentum behind the second push was noticeably weaker.
| Rally | Price High | MACD Histogram Peak |
|---|---|---|
| First Rally | $55 | 1.2 |
| Second Rally | $58 (new high) | 0.7 (lower peak) |
What makes the histogram useful is that it reacts faster than the MACD line itself, since it's measuring the distance between the MACD line and its signal line. Shrinking histogram bars on each successive price swing are often one of the earliest hints that a trend is losing steam.
On most charting platforms, you can display RSI and MACD stacked below price simultaneously, which makes this kind of comparison much faster to do visually instead of manually plotting values.
Want expert trading insights delivered daily?
Join thousands of traders who rely on Traders Agency for market analysis and trade ideas.
Join Traders AgencyCan I Use RSI and MACD Together in Trading?
Yes, and we'd argue you should. RSI and MACD measure momentum differently, so when both show divergence at the same time, that overlap gives you more conviction than relying on either indicator alone.
RSI is a bounded oscillator running between 0 and 100, built to flag overbought and oversold conditions. MACD is unbounded and tracks the relationship between two moving averages, making it better at showing the broader momentum trend. Neither indicator is objectively better, they just answer slightly different questions.
Here's a working example we use in our training sessions. A stock trades up from $100 to $112, pulls back to $106, then rallies again to a new high of $115.
| Indicator | First High ($112) | Second High ($115) |
|---|---|---|
| RSI | 74 | 65 (lower) |
| MACD Histogram | 1.4 | 0.9 (lower) |
Both indicators are confirming bearish regular divergence at the same time. That kind of dual confirmation is exactly what separates a high-conviction setup from a coin flip. We'd typically treat this double-confirmation as a trigger to tighten stops on long positions or look for short entries on the next bounce.
Why not just use one indicator?
Single-indicator signals produce more false positives. Combining RSI and MACD divergence cuts down on noise, though it also means fewer total setups, since you're waiting for agreement between two tools instead of acting on the first signal you see.
How Do You Confirm Divergence Across Multiple Timeframes?
Divergence on a 5-minute chart happens constantly and most of it is meaningless noise. Divergence on a daily chart happens far less often and tends to carry more weight.
Our approach is to identify divergence on a higher timeframe first, like the daily or 4-hour chart, then drop down to a lower timeframe such as the 15-minute or 1-hour chart to time the actual entry. This matters a lot for day traders, who often get burned by treating every intraday divergence signal as tradeable on its own.
Our multi-timeframe checklist:
- Step 1: Confirm divergence on the higher timeframe. Check for divergence on the daily or weekly chart first.
- Step 2: Check the middle timeframe. Drop to a 1-hour or 4-hour chart to look for the same directional disagreement.
- Step 3: Fine-tune the entry. Use a 5-minute or 15-minute chart only to refine your entry price once the higher timeframes agree.
- Step 4: Skip unconfirmed signals. Avoid acting on divergence found on only one timeframe with no backup on a higher one.
This layered approach doesn't eliminate false signals, nothing does, but it meaningfully reduces how often you get caught trading noise instead of a real shift in momentum.
What Are Common Mistakes When Trading RSI MACD Divergence?
Even experienced traders fall into these traps repeatedly. We see them constantly in member questions.
- Trading every divergence signal: Not all divergence leads to a reversal or continuation. Treat it as a warning to watch closely, not an automatic trade trigger.
- Ignoring the broader trend: Trading regular divergence against a strong trend without confirmation is how a lot of accounts get hurt.
- Skipping confirmation entirely: Entering the moment you spot divergence, without waiting for a price structure break or candle confirmation, increases your odds of getting stopped out.
- Confusing regular and hidden divergence: Mislabeling a continuation setup as a reversal setup leads to trading against the dominant trend by mistake.
- Using only one indicator: Relying solely on RSI or solely on MACD misses the added conviction that comes from agreement between the two.
Adding a moving average into the mix can help here. If price is above a rising 50-period EMA, we're far more cautious about acting on bearish divergence, since it's fighting the trend. If price is below a falling EMA, bullish divergence needs extra confirmation before we'd consider it a reversal candidate rather than just a bounce.
When Should You Avoid This Strategy?
Divergence trading tends to underperform in choppy, range-bound markets where price and momentum oscillate constantly without committing to a real direction. In these conditions, you'll see divergence signals fire repeatedly with no follow-through, which just burns time and, if you're trading live, capital.
It also struggles during strong, sustained trends driven by major news or earnings, where momentum indicators can stay "overbought" or "oversold" for extended stretches while price keeps running. None of the common momentum tools solve the problem of a trending market ignoring overbought readings. In that environment, waiting for divergence to "confirm" a reversal can mean missing a large chunk of the move, or worse, fighting a trend that has no intention of reversing yet.
Risk management basics for this approach
- Never risk more than 1-2% of account capital on a single divergence-based trade.
- Place stops beyond the most recent swing high or low that formed the divergence pattern, not at an arbitrary dollar amount.
- Treat divergence as one input alongside support/resistance, volume, and trend structure, not a standalone signal.
- Scale position size down when trading against a strong prevailing trend, even with confirmed divergence.
Watch Out: Divergence signals in choppy, range-bound markets fire often and fail often. Treat every signal as a prompt to watch closely, not a guaranteed trade trigger.
Frequently Asked Questions
What is RSI and MACD trading?
RSI and MACD trading uses two momentum indicators, the Relative Strength Index and Moving Average Convergence Divergence, to gauge the strength behind price moves and spot divergence between price and momentum.
What does divergence on the MACD indicate?
MACD divergence occurs when price and the MACD line or histogram move in opposite directions, often signaling that the current trend's momentum is weakening and a reversal or pause may be approaching.
Should I use RSI or MACD?
Both have value. RSI is better for spotting overbought/oversold extremes, while MACD is better for tracking broader trend momentum, so we recommend using both together for confirmation.
Can I use RSI and MACD together in trading?
Yes. Using both indicators together and looking for agreement on divergence signals reduces false positives compared to relying on either indicator alone.
Does RSI and MACD divergence work for day trading?
It can, but day traders should confirm intraday divergence against a higher timeframe trend first, since lower timeframe signals produce far more noise and false positives.
What's a common beginner mistake with divergence trading?
Treating every divergence signal as an automatic trade entry, rather than waiting for price confirmation or agreement between RSI and MACD.
Want expert trading insights delivered daily?
Join thousands of traders who rely on Traders Agency for market analysis and trade ideas.
Join Traders AgencyDISCLAIMER: Traders Agency does not offer financial advice. The information provided is for educational purposes only and should not be considered financial advice. Traders Agency is not responsible for any financial losses or consequences resulting from the use of the information provided. Trading carries inherent risks and may not be suitable for all individuals. You are advised to conduct your own research and seek personalized advice before making any investment decisions, recognizing the potential risks and rewards involved.
See more from Traders Agency on Google
Make us a preferred source and our market analysis will appear more prominently in your Google Search, Top Stories, and AI results.
Add to Preferred Sources