

Hey, Ross here:
There’s a strong case for buying stocks right now.
There’s also a warning I wouldn’t brush aside.
Today’s two charts show you why.
Chart of the Day
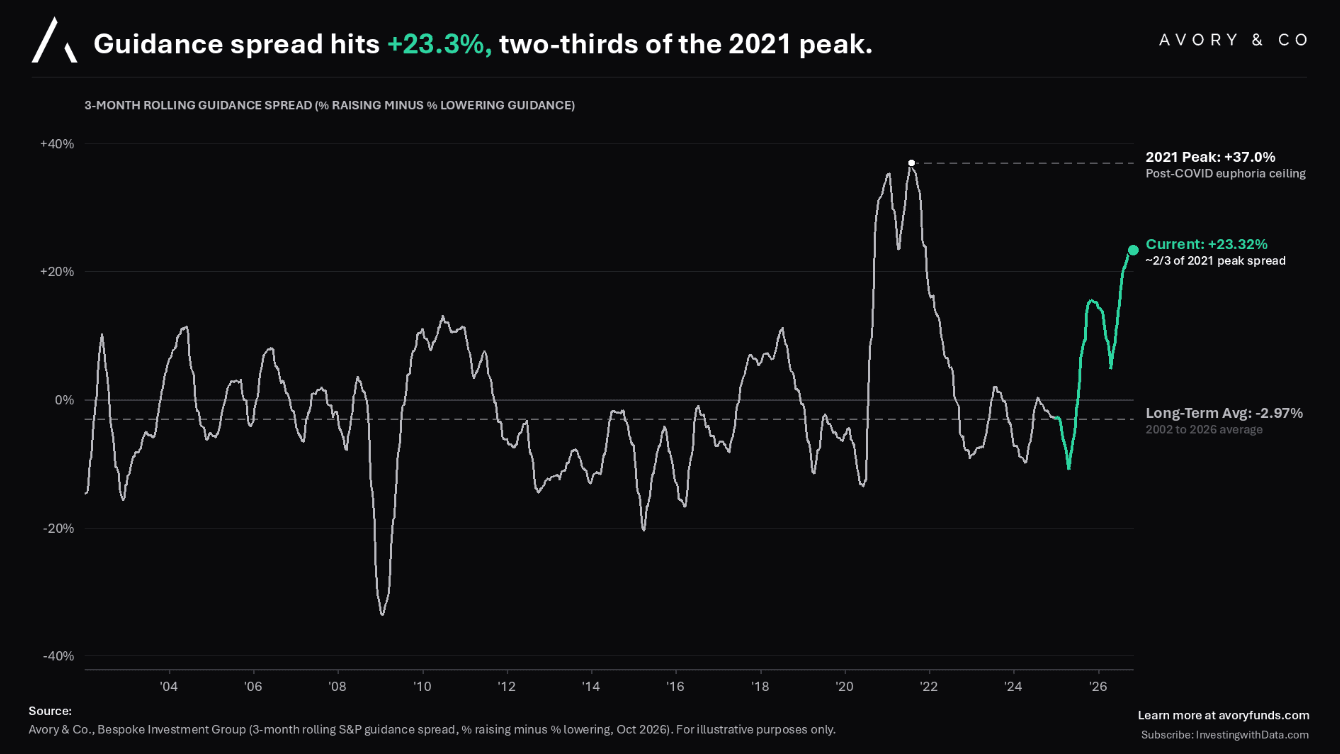
This first chart tracks companies raising their forecasts versus those cutting them.
Above zero means more companies are raising their outlook. Below zero means more are lowering it.
Look at the green line on the right.
Over the past three months, the share raising forecasts exceeded the share cutting them by 23.3%
That’s well above the long-term average, shown by the dashed line just below zero.
So the bullish argument has something behind it.
A lot of businesses are expecting better results.
But now look at what’s happening among weaker borrowers.
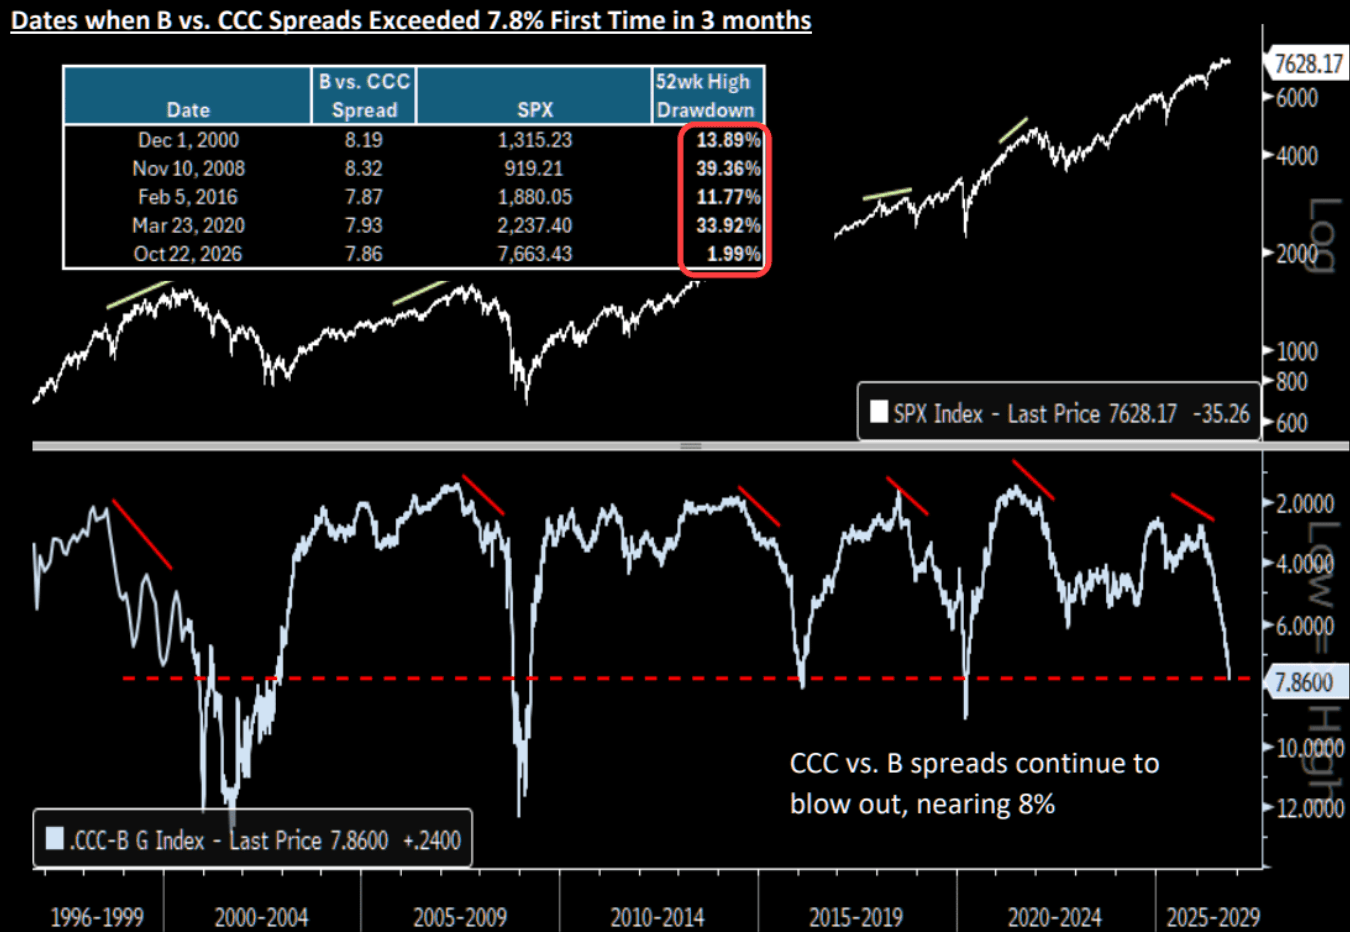
This chart compares two groups of companies with low credit ratings.
CCC-rated companies are considered riskier than B-rated companies.
Investors demand more interest to hold their debt.
The bottom panel tracks how more yield investors are demanding to hold CCC vs B-rated debt.
The scale is flipped, so a falling line means the gap is getting WIDER.
It recently reached almost eight percentage points – the widest since March 2020.
And if you look at the table in the top-left corner…
You’ll see that during the previous times when the spread was this high…
The S&P 500 was down double-digits – or in a straight up bear market.
But right now, it’s only a couple points off its high.
In short…
Companies are raising their forecasts…
While lenders are demanding much more interest to own the weakest borrowers’ debt.
How do we put those two pictures together?
I explain below.
Insight of the Day
Strong earnings don’t tell us whether the whole market is healthy.
Both charts can be right.
A profitable company with plenty of cash can keep growing while a weaker business struggles to pay its bills.
And when that weaker business needs to borrow again, a higher interest bill makes the problem worse.
The question is whether those problems stay with the weakest borrowers – or start spreading.
If they stay contained, there can still be plenty of strong stocks to trade.
But if lenders pull back more broadly, even companies that look healthy can find it harder to fund their plans.
That’s why I won’t dismiss the credit warning just because earnings look strong.
But I also won’t treat the four past episodes as proof that a crash is coming.
I want to see where the strain is building, which businesses can withstand it, and whether buyers are still backing the strongest stocks.
That’s the bigger picture we need to work through as we head into November.
By the way, these are precisely the things I cover in my Black Ops Trading Club.
Strong earnings on one side. Warning signs in the credit market on the other.
You need to know how those pieces fit together before you put your money on the line.
Every Friday, my members get an intel briefing where I break down what mattered that week – and what I’m watching next.
And right now, you can get a full year of those briefings for just 99 cents.
You’ll also join me for TWO live sessions every week.
I’ll break down the market in real time, show you which sectors are gaining strength, and spotlight trade setups that most traders haven’t noticed yet.
You’ll see what I’m watching, why I’m watching it, and what I need to see before putting money on the line.
Plus, you’ll get my training vault and my report on the number-one trade setup of 2026.
That’s nearly $4,000 in value for less than a buck.
This Halloween price won’t last much longer.
Click here to claim your full year for just 99 cents.
Customer Story of the Day
"My experience with Trader's Agency has been stellar.
Customer Service called and we discussed the various trading groups.
The group I am currently subscribed, and others I will consider in the near future.
Ross Givens is amazing and I listen to his webinars every day! Looking forward to the Insiders Edge!!!”
Embrace the surge,

Ross Givens
See more from Traders Agency on Google
Make us a preferred source and our market analysis will appear more prominently in your Google Search, Top Stories, and AI results.
Add to Preferred Sources