US stocks opened lower Tuesday morning after the market holiday on Monday, but they climbed back throughout the day to end flat.
And leading the rebound again were biotechs like Alkermes plc (ALKS), a $5 billion biopharmaceutical company focused on developing treatments for mental illness, addiction and cancer.
The stock was up 3% on Tuesday as it started to break out above a two-month consolidation range.
I’ve had my eye on this stock for a while, and I’m now making my move.
Here’s where I plan to buy…
The Big Picture
Fundamentally, biotechs are one area showing a lot of strength as the market comes off its lows.
This is a potential area of leadership, so I am giving the names in this sector additional attention.
But this is also a very strong technical setup.
Let’s zoom out and take a closer look at the weekly chart to get the longer-term view of the stock…
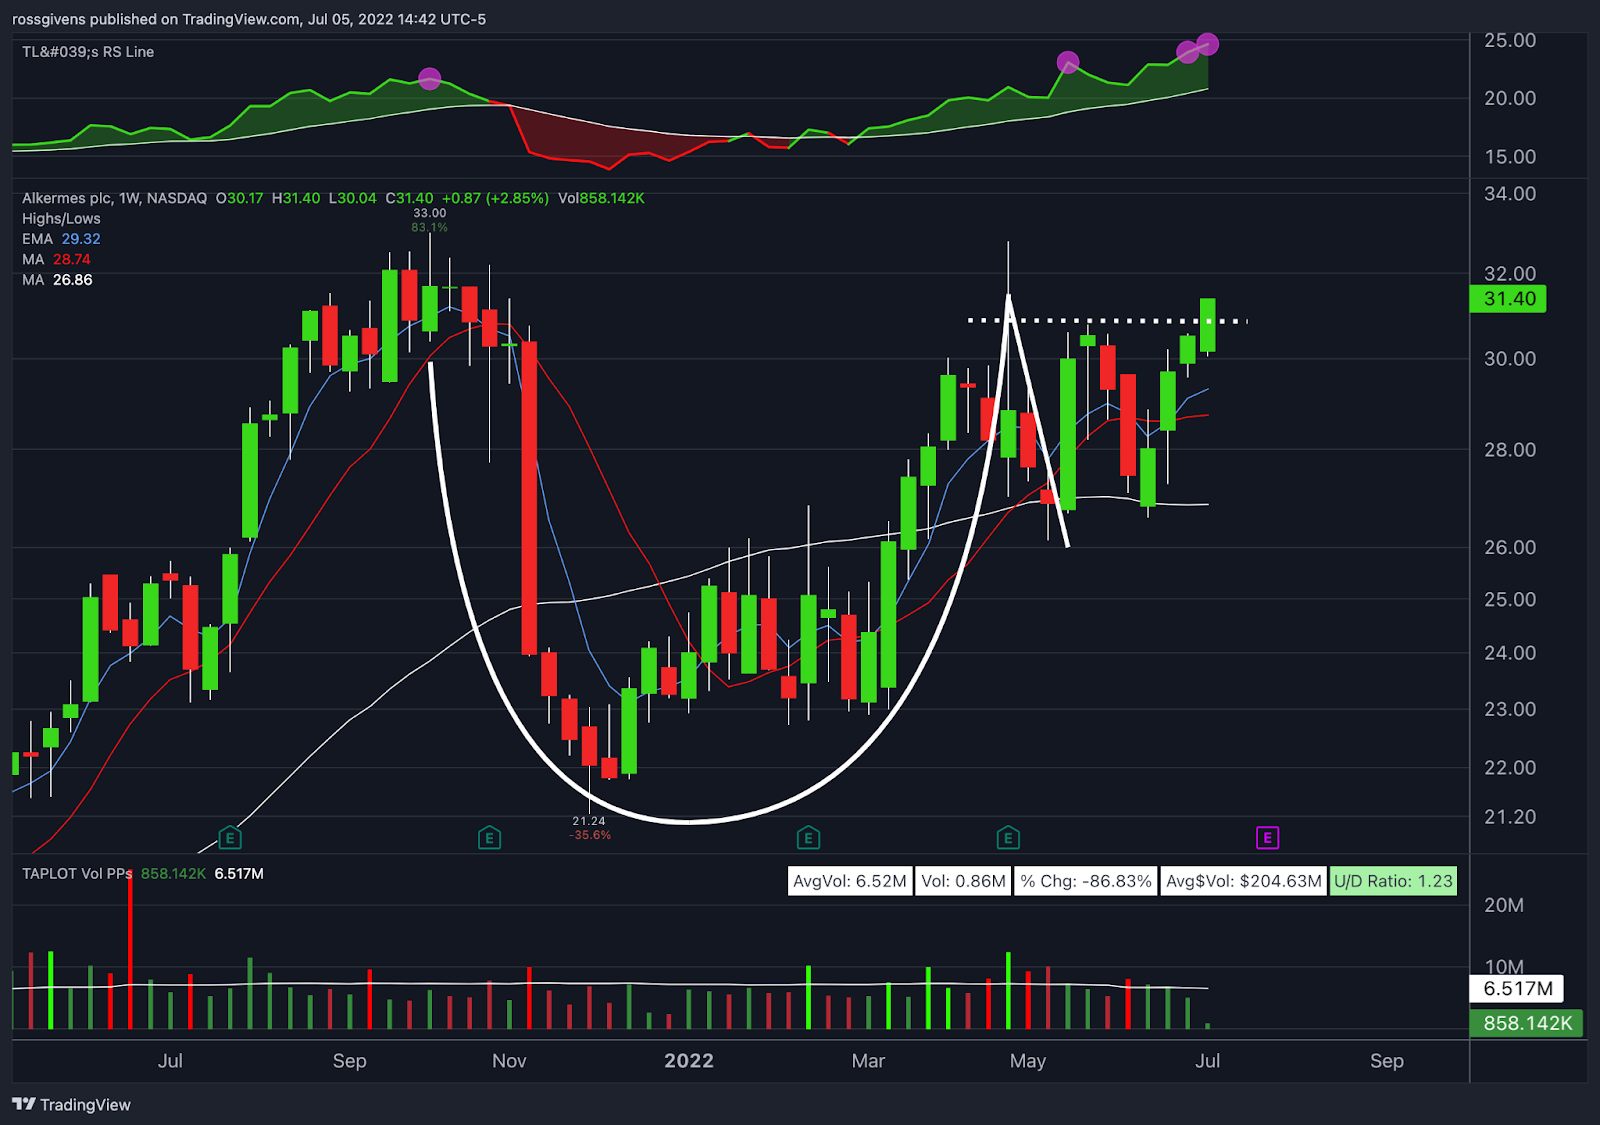
The weekly chart shows a classic “cup with handle” pattern that began last October, which is a well known but little understood price pattern.
It got its name because it looks something like a coffee cup, with a U-shaped base and a downward trending consolidation range that looks like a handle.
These are bullish patterns that usually take shape over weeks or months, and the breakouts can be spectacular.
You can see that after compressing nicely on the right side of the chart as sellers were absorbed, price is now starting to break out from the handle of the pattern.
Zooming In
On the daily time frame, there is a nice, tight pivot point near $30.60, which was acting as resistance for the past few months.
This was my entry trigger for this idea…
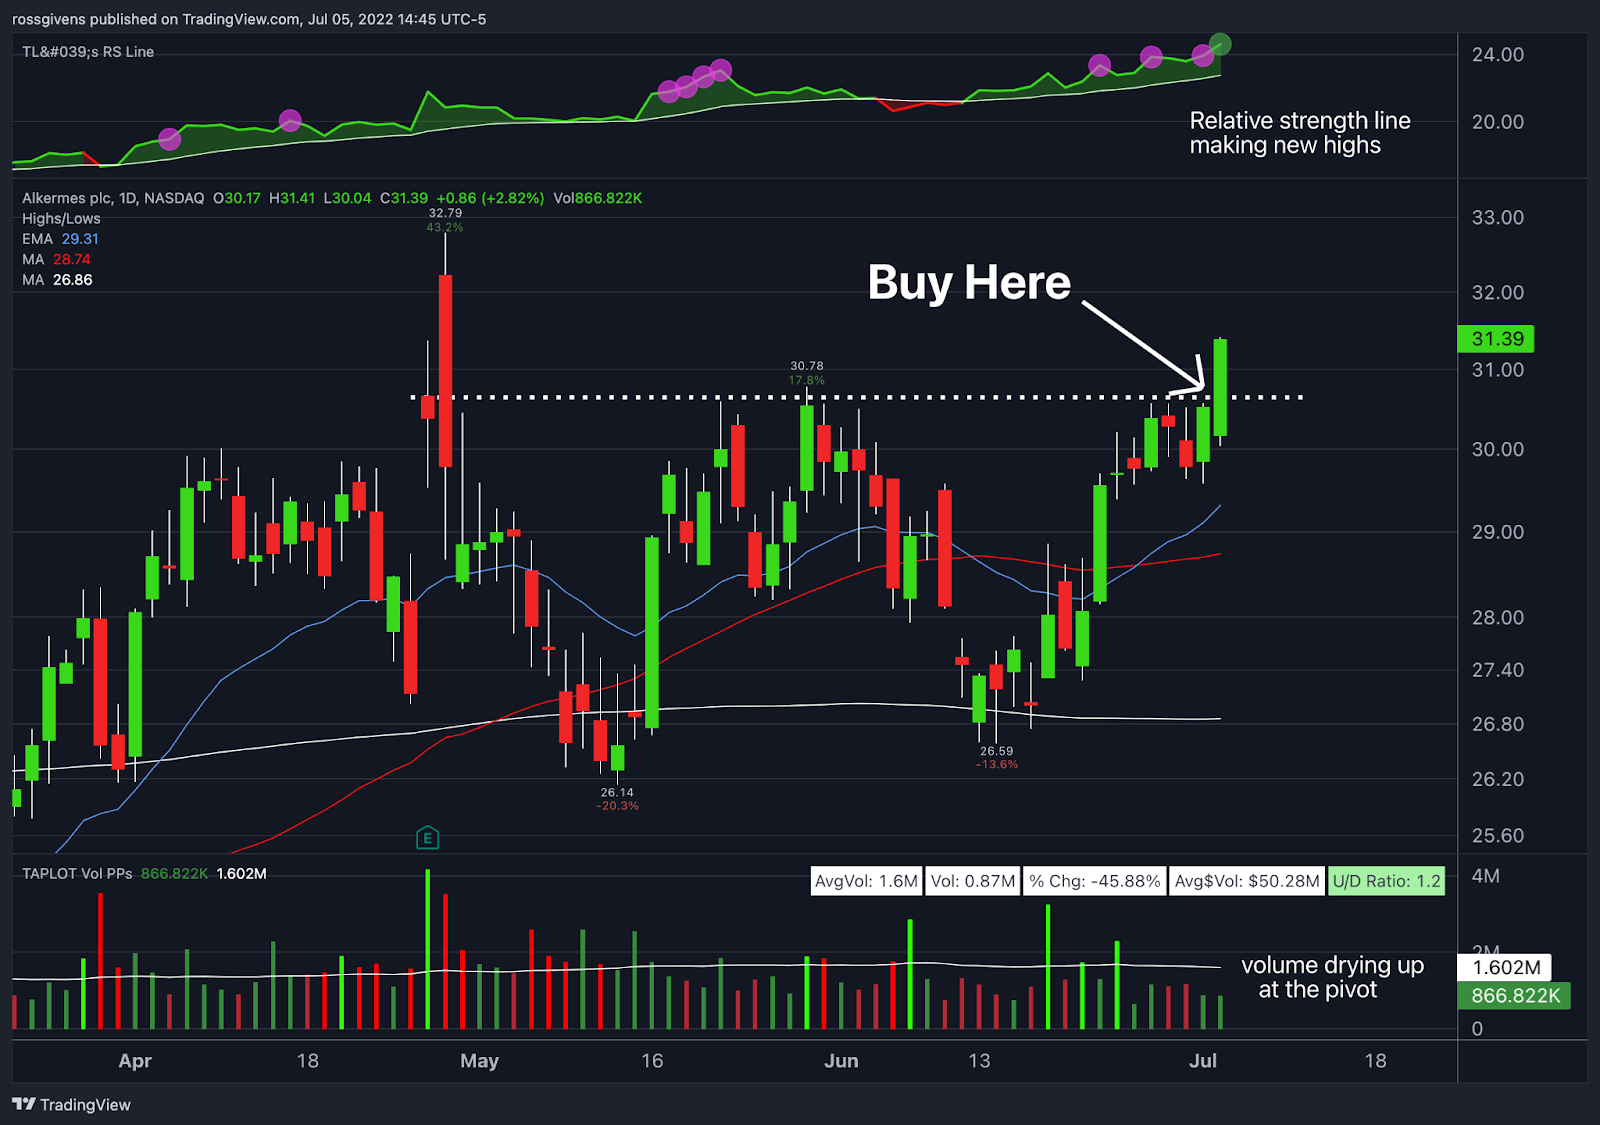
ALKS has all of the signs that I like to see in a bullish trade idea…
Pullbacks are shallowing, volume is decreasing and the stock has formed a nice, tight pivot near $31.
Volume has dried up particularly over the last several days at resistance, which is generally a sign that supply is no longer coming to market.
In other words, the stock is becoming harder to buy as fewer people want to sell, so a break of this key level could lead to a strong move higher.
The relative strength line in the top panel of the chart has also been making new highs for several weeks, which tells you the stock is outperforming the market.
This is not part of our Watchlist or an official recommendation, but I wanted to bring it to you today to show you what I’m on the lookout for in this market.
I’ll do my best to keep you posted as this trade progresses…
Ready for the Big Debut?
Before I go, I need to invite you to a LIVE special event happening on TODAY at 12:00 p.m. EST…
My colleague and expert trader Josh Martinez is set to unveil his brand-new professional-grade system that virtually anyone can use with minimal upfront investments…
We’re talking as low as FIFTY BUCKS! You don’t want to miss this!
Click here to snag your seat for the main event happening TODAY at 12:00 p.m. EST.
Embrace the surge,

Ross Givens
Editor, Stock Surge Daily
The post Here’s a Stock You Might Like… appeared first on Stock Surge Daily.