Good morning, Traders!
We’ve made it through another month. Congratulations on working so hard to become a successful futures trader! Now, take a quick moment to catch your breath. Leave your past trading mistakes behind and prepare for a fresh start. Ready? Let’s go!
Today we’re focusing on the Nasdaq 100 E-mini Futures market (NQ). Both the long-term and short-term directions are up as the market goes through a retracement and prepares for a bullish push.
Right now, we’re waiting for the NQ to break our counter trendline. A counter trendline breakthrough lets us know that the market is about to make a bullish run into the buy zone. Once that happens, we can prepare to execute our entry strategy.
And when that bullish push happens, we can expect the market to make its way up toward the 16072.25 limit. As that happens, we’ll watch for opportunities to buy the market at low prices!
Now let’s examine the NQ timeframe analysis for more details about the current setup:
Daily Timeframe Analysis
The daily timeframe confirms that the overall direction for the NQ is up. Remember that an up trend means the market is making higher highs and higher lows on its way toward a new high price.
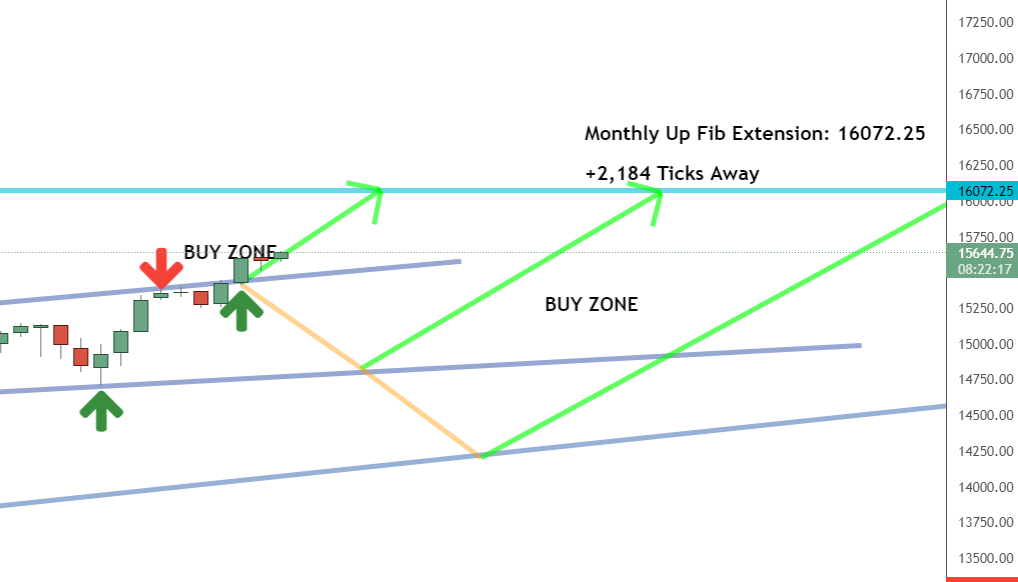
The NQ is working its way through the buy zone and toward the 16072.5 price point. This means we have more than a +2,000 tick opportunity with this trade. And don’t forget how important tick movements are when it comes to our goal of making money with our trades!

The long-term direction is up for the NQ

The short-term direction of the NQ is currently up

The NQ has broken the counter trendline and entered the buy zone
Learn more about the Daily Direction Indicators here…

The NQ is poised to rally through the buy zone on its way to the 16072.5 Fibonacci extension
After we’ve fully analyzed our daily timeframe, we’ll want to turn to the one-hour timeframe to look for buying opportunities in the market. That’s how these various timeframes work together: they give us the data we need to make informed decisions about implementing our trading strategy. And without this information, your chances of making money in the market drop.
One-Hour Timeframe Analysis
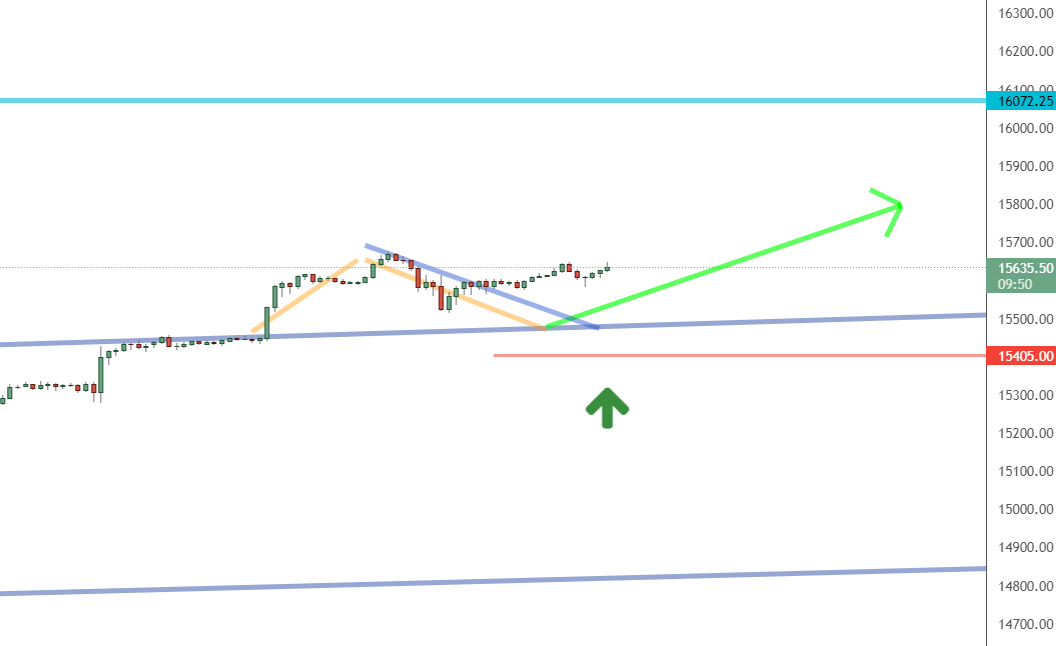
Looking at the NQ’s one-hour timeframe, we see that the market has broken the counter trendline (short diagonal grey line) and is pushing bullish toward the up Fibonacci extension.
This is our chance to buy the market at a low price within the buy zone as it moves to the 16072.5 price point. The +2,000 tick movement means there’s room to make money with this trade if you get in at the right moment. If you miss the timing on this, you won’t maximize your profit potential. That’s why following my strategy is so important if your goal is to increase your chances of making money with your trades.

The NQ is breaking through the counter trendline and pushing bullish to the next Fibonacci extension
If we want to execute this trade properly, we’ll need to concentrate on our timeframe charts and keep a close eye on the market. We want to buy at a low price, but we won’t be able to do so if the market falls out of the buy zone. Similarly, we don’t want to enter the market too late, when the price has risen too high. It’s all about the timing!
The Bottom Line
As the market breaks the counter trendline and pushes bullish, both the long-term and short-term directions for the NQ are up. We’ll keep an eye on the timeframe charts for opportunities to buy the market at low prices as long as the market remains in the buy zone. And that is how we make money in futures trading!

As long as the NQ stays in the buy zone, we’ll watch for opportunities to buy the market as it rallies bullish
However, you can’t profit from futures trading until you trade! Take a look at my strategy to see how it works so you can get started right now. Once these trends begin, there is limited time to get involved without falling behind. This is an opportunity you cannot afford to pass up!
Keep On Trading,

Mindset Advantage: Plan Or Fail
“Everyone has a plan… until they get hit in the face.”
So goes the famous quote from a boxer infamous for knock-outs.
Do you have a plan? Can it withstand a sucker punch?
If not, get one.
Start with what you’re willing to lose… each trade, day, week, month and year.
Only with that in mind should you ever focus on the profits.
Anything else is just a prelude to failure.
Your account and trading career will thank you.
Traders Training Session

Understanding Futures Contract Sizes and Tick Values
Stay tuned for my next edition of Josh’s Daily Direction.
And if you know someone who’d love to make this a part of their morning routine, send them over to https://joshsdailydirection.
The post Leave your bad trades behind this month appeared first on Josh Daily Direction.


