Good morning, Traders!
Well, the Nasdaq 100 E-mini futures market (NQ) is now up for both the long-term and short-term directions, just as I predicted. If you missed my initial analysis of the NQ, be sure to check it out now!
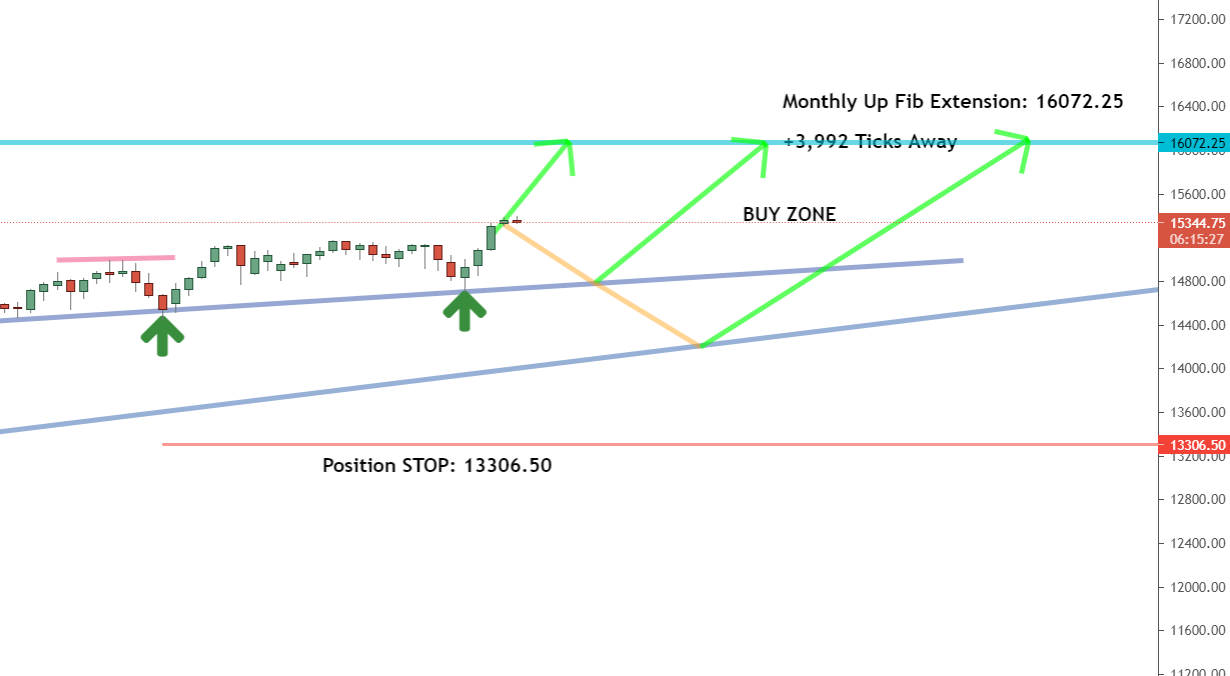
The market closed above resistance and is now headed for the 16072.5 up Fibonacci extension. That means we have opportunities developing that will allow us to buy the NQ and ride the wave up to a new high price.
Once the market gives us a counter trendline break, we’ll turn to our one-hour timeframe chart and look for signs that it’s time to execute our entry strategy.
This is a good time to learn how to jump into a futures market and make money as the market sets its sights on higher prices. Remember that we buy at low prices in the buy zone and then sell at a higher price to make profit. It’s that simple if you follow my strategy.
And before we jump into the timeframe analysis for the NQ, I wanted to take a moment and give you some exciting information about my new VIP Bundle Club!
With the VIP Bundle, you get access to strategies that aren’t available to anyone else. I’ll also give you guidance on how to adjust your approach to the market based on current expectations. And I’ll even provide insight every month about the next big trading idea for the coming month. This is something you can’t afford to miss. I’m hosting a free webinar today at 5 PM ET. Click here to sign up now and secure your spot. This will fill up quickly, so reserve your spot now!
Did you click the link to sign up? If so, we’re now ready to take a look at the NQ timeframe analysis:Daily Timeframe Analysis
Just as I predicted in my previous writeup about the NQ, the market is above resistance and headed for a new high price. That means we’re almost ready to jump into the market. But first, we need to see a counter trendline break before we start to buy!DAILY TIMEFRAME

The long-term direction is up for the NQ

The short-term direction of the market is now up for the NQ

The NQ is above resistance and headed to a higher price
Learn more about the Daily Direction Indicators here…

The NQ is now above resistance and headed for the 16072.5 price point. Now we’ll wait for a counter trendline break as we prepare our entry strategy
Not sure how counter trendline breaks work? Check out my article on the subject to see for yourself! This is an important part of my trading strategy, so don’t skip over it!
| Recommended Link:Josh Martinez has become an expert at identifying financial patterns that tend to repeat themselves consistently time and time again. And just as his track record shows, he’s identified a new “Millionaire’s Pattern” emerging right now. The last time an anomaly this BIG was spotted in the financial markets, he was able to shape an initial deposit investment of $500 into $39,282! Based on our research, we are at the starting point of the “Next Big Thing”. Only this time, we’re talking about a far BIGGER,$500-into-$50,000 opportunity… Use this special link to explore Josh’s #1 investment opportunity for 2021 |
One-Hour Timeframe Analysis
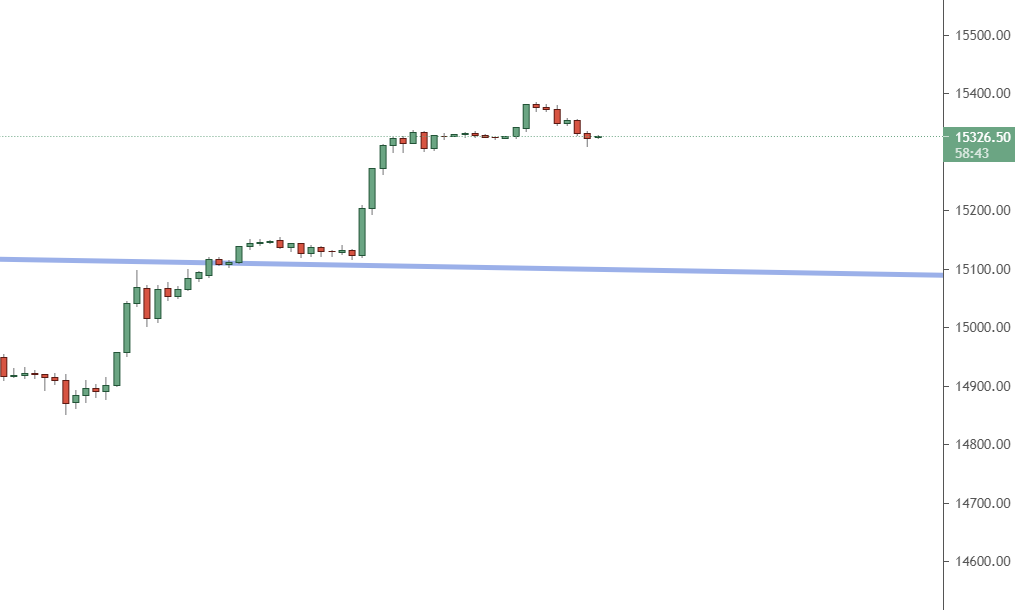
As the NQ enters the buy zone, we’ll want to focus on the one-hour timeframe in order to prepare our entry strategy for the market.
We analyze the one-hour timeframe to look for low prices in the buy zone that we can buy. And if we catch a market just as we confirm that it’s entering the buy zone, we can enter the market at a great price as it begins its upward movement to the next high price!

We’ll watch the one-hour timeframe as we prepare our entry strategy for the NQ
To better understand the differences between the long-term and short-term outlooks for a market, take a look at this free resource. You’ll need it when you plan to make your trades.The Bottom Line
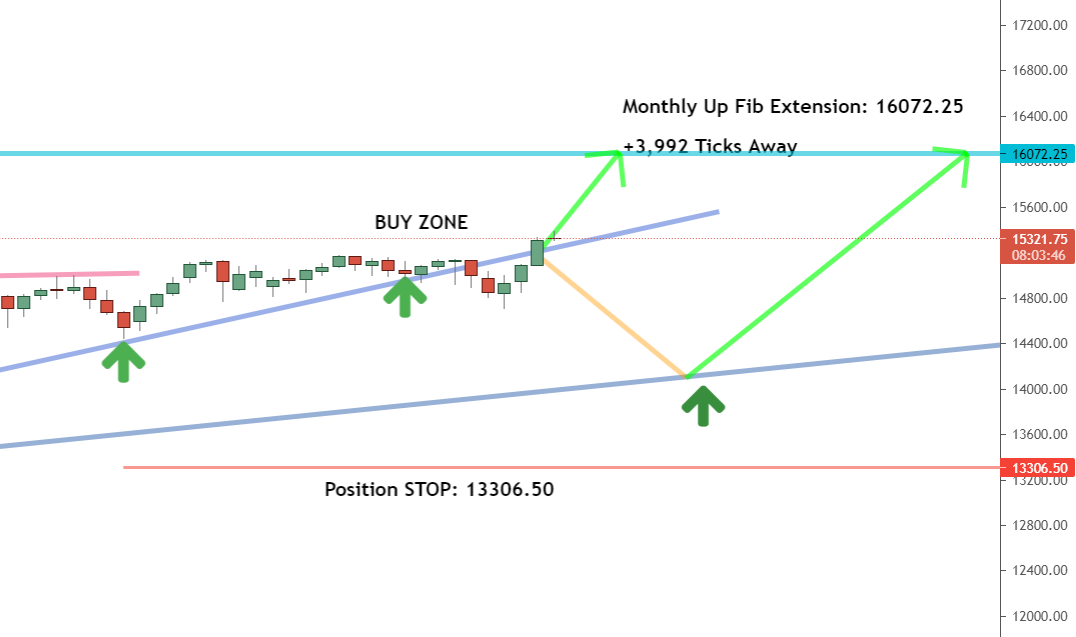
The NQ is now closing above resistance and is approaching the buy zone. That means both the long-term and short-term directions for the market are up. We can expect buyers to drive the market even higher if this current trend holds.
We’ll focus on our timeframe charts, especially the one-hour timeframe, to find opportunities to buy the NQ and watch the market rise toward the 16072.5 price point.

We’ll watch the NQ as it continues to move within the buy zone
So what are you waiting for? Dump the excuses and get started now! Follow along as I reveal the crucial aspects of my trading strategy that will allow you to become a profitable futures trader!
Keep On Trading,

Mindset Advantage: Better Today
Look forward and forget the past. At least for today. Adopt the mantra: Better today than yesterday. Better tomorrow than we are today.
The journey to consistent profits is not built with a trade or a single session. We all know this… but then we proceed to hold positions longer than we should, move stops that we shouldn’t and trade outside our plan.
How about one day at a time?
Start with today. Tomorrow comes later.Traders Training Session

Understanding Trading Margin and Managing Losing Trades
The post My prediction was on target! appeared first on Josh Daily Direction.


