On Thursday morning, the latest consumer price index (CPI) report showed that inflation is still running at an annual pace of over 8%.
Initially, this caused a big drop in the market early on in the trading day.
However, by the end of the day, the major indexes ended up by over 2% to stage one of the biggest intraday reversals in recent memory.
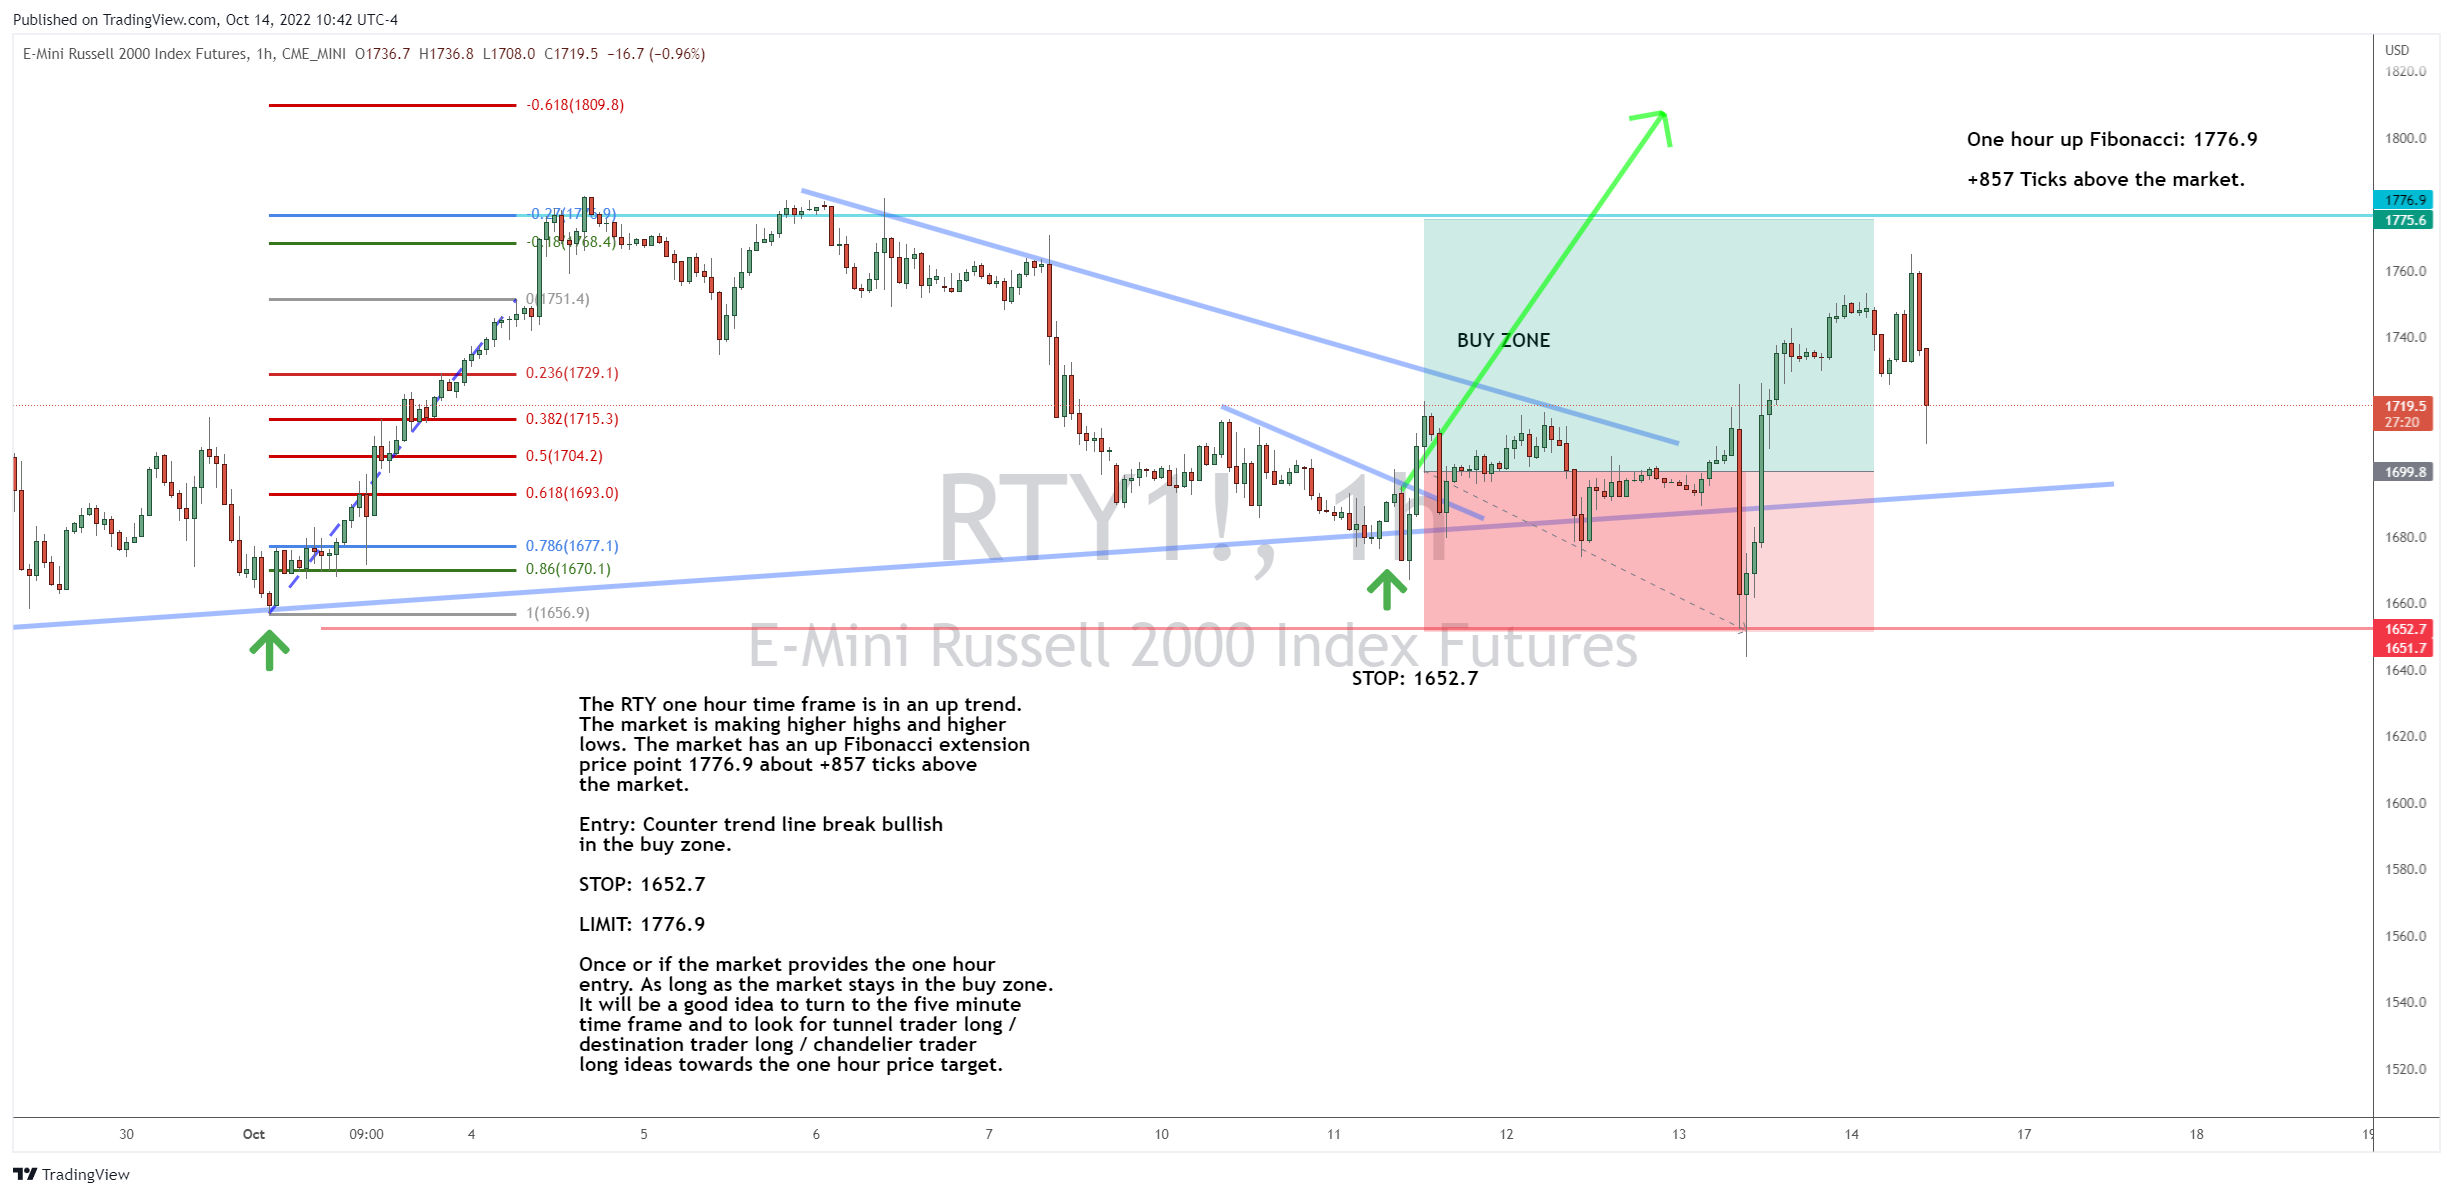
That put the Russell 2000 (RTY) back into the hourly buy zone, so let’s take a look at the chart and see how it’s setting up heading into the weekend.
Looking for Longs
Here’s how the daily chart is shaping up…

The RTY one hour time frame is in an up trend. The market is making higher highs and higher lows.
The market has an up Fibonacci extension price point 1776.9 about +857 ticks above the market.
Entry: Counter trend line break bullish in the buy zone.
Stop: 1,652.70
Limit: 1,776.90
Once or if the market provides the one hour entry, and as long as the market stays in the buy zone, it will be a good idea to turn to the five minute time frame and to look for Tunnel Trader long / Destination Trader long or Chandelier Trader long ideas towards the one hour price target.
The Bottom Line
With inflation on a fast-track, you need to know how to amplify your gains.
To see how I do it, check out the link in the P.S. below…
For more on the markets as well as trading education and trading ideas like this one, look for the next edition of Josh’s Daily Direction in your email inbox each and every trading day.
I’ll be bringing you more of my stock and futures contract trading tutorials as well as some additional trading ideas.
And if you know someone who’d love to make this a part of their daily trading routine, send them over to joshsdailydirection.com to get signed up!
Keep on trading,

P.S. Countless everyday Americans are earning anywhere from an extra few hundred bucks a week…
Get the urgent details — and a special $5 deal for a full year of my War Room — right here…
The post Small Caps Bounce Back in a Big Way appeared first on Josh Daily Direction.


