I can make anyone a profitable stock trader with my swing trade strategy.
You don’t need a degree in finance. You don’t need securities licenses. You certainly don’t need 10,000 hours behind a screen staring at charts until your eyes bleed.
If you can work a computer and pass third-grade math, you can do this.
I’m a 20-year veteran of the financial markets and a former Vice President of Investment Management with JP Morgan Chase. I’ve coached tens of thousands of traders. And the reality of the market is far simpler than Wall Street wants you to believe.
You only need to know three things: the signs of a potential big winner, precisely where to buy and sell, and how to keep risk small while maximizing gains.
I’m going to distill two decades of market knowledge into a single strategy.
The Precision Swing Trade
Your job is to enter a stock at a precise moment where it has a high likelihood of delivering a big and fast gain.
I’m not interested in buying stocks that bounce around sideways for six months before they finally go somewhere. I want that quick burst. I’m looking for moves of 30%, 50%, or 80% plus in the two-to-eight-week range. Once I get that move, I get out and move on to the next one.
This is swing trading.
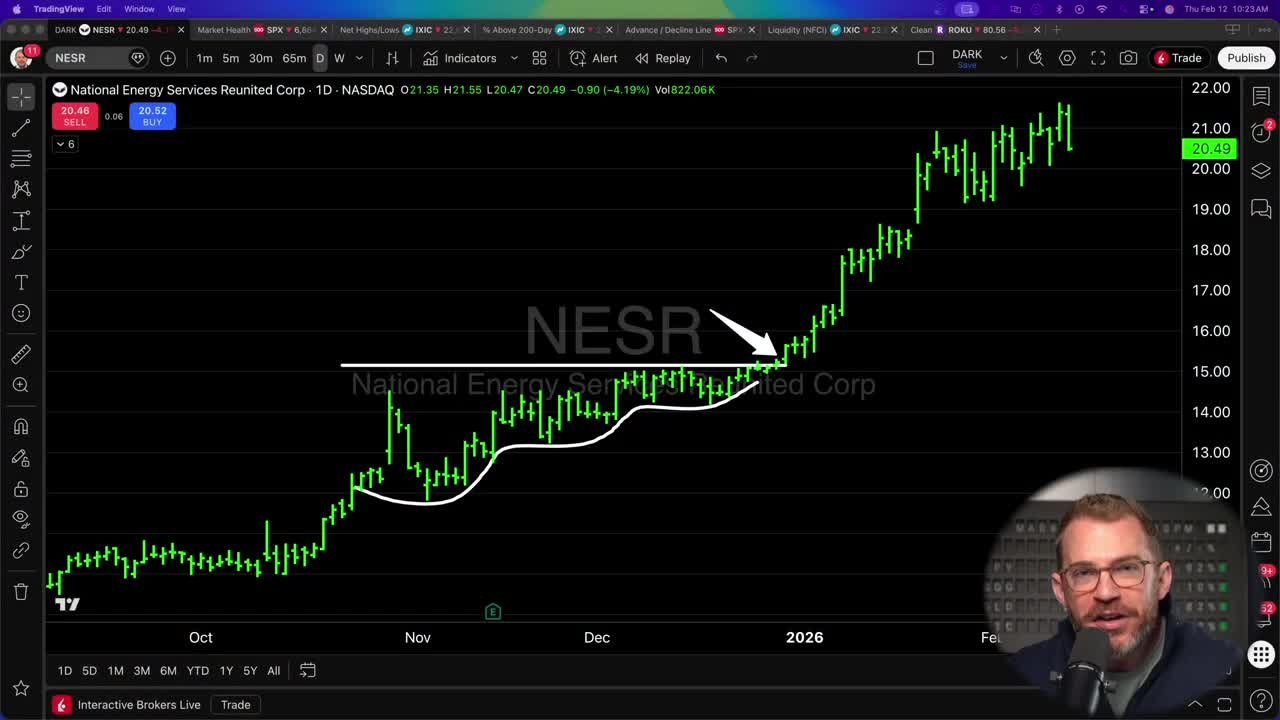
Take National Energy Services (NESR) as a prime example. This stock quickly rose from about the $15 mark to $22 in about six weeks. That’s the type of velocity we’re looking for.
But to catch moves like that, you have to understand what actually moves stock prices.
Retail investors don’t move markets. Mom and pop investors with 401(k)s don’t move markets.
Prices are moved by large, multi-billion dollar institutional funds. Warren Buffett. Goldman Sachs. The Notre Dame endowment fund. The New York City pension fund. Big ETFs, hedge funds, and mutual funds are the whales. They move prices simply because they’re buying so much volume.
When these entities buy, two things happen. First, it takes them months to build a position because they’re buying billions of dollars worth of stock. Second, they leave a distinct footprint on the chart.
Supply and Demand Manipulation
The stock market operates on basic principles of supply and demand. It’s an auction, no different than eBay.
When a big fund wants to take a large position, they aren’t buying 100 shares. They want to buy 100 million shares. The problem is that demand exceeds supply. There aren’t 100 million shares sitting there for sale at the current price.
So they have to manufacture supply.
They engage in tactics to shake shares loose from retail investors:
- Having analysts downgrade the stock
- Floating negative articles about why the sector is in trouble
- Spoofing orders—sending big sell orders when volume is light to drive the stock down
Their goal is to scare you. They want to shake you out or bore you out of the stock. They’re giving investors reasons to sell the stock to them. They want to absorb all that supply in a specific price range—say, the $12 to $14 area—until there’s no more supply left at that price.
Once everyone willing to sell at $14 has sold, the supply is gone. The remaining shares are held in ETFs, 401(k)s, or executive accounts and aren’t for sale.
If the institution wants to keep buying, they have to bid higher. “Will you take $16? $17? $18? $20?”
That’s what causes the stock to make a big, fast run. It isn’t that the company suddenly “got good.” It’s simply too many dollars chasing too few shares.
The Shallowing Pattern
We can see this institutional activity playing out through a specific technical setup I call the Shallowing Pattern.
First, you see a massive surge. NESR went up about 50% in three weeks. This is a telltale sign that big institutions are buying. A multi-billion dollar company doesn’t move 50% in three weeks unless large Wall Street buyers are getting in.
Once that move happens, the stock is “in play.” We have proof of demand. Next, we wait for the pullback.
The Psychology of the Pullback
After a 50% run, you get profit-taking. People who bought at $10 see it at $15 and sell to lock in gains. The stock dips.
But if the stock is truly in demand, institutions will step in to buy that dip, driving it back up. Then you get a little more profit-taking. It dips again, but this time the dip is shallower.
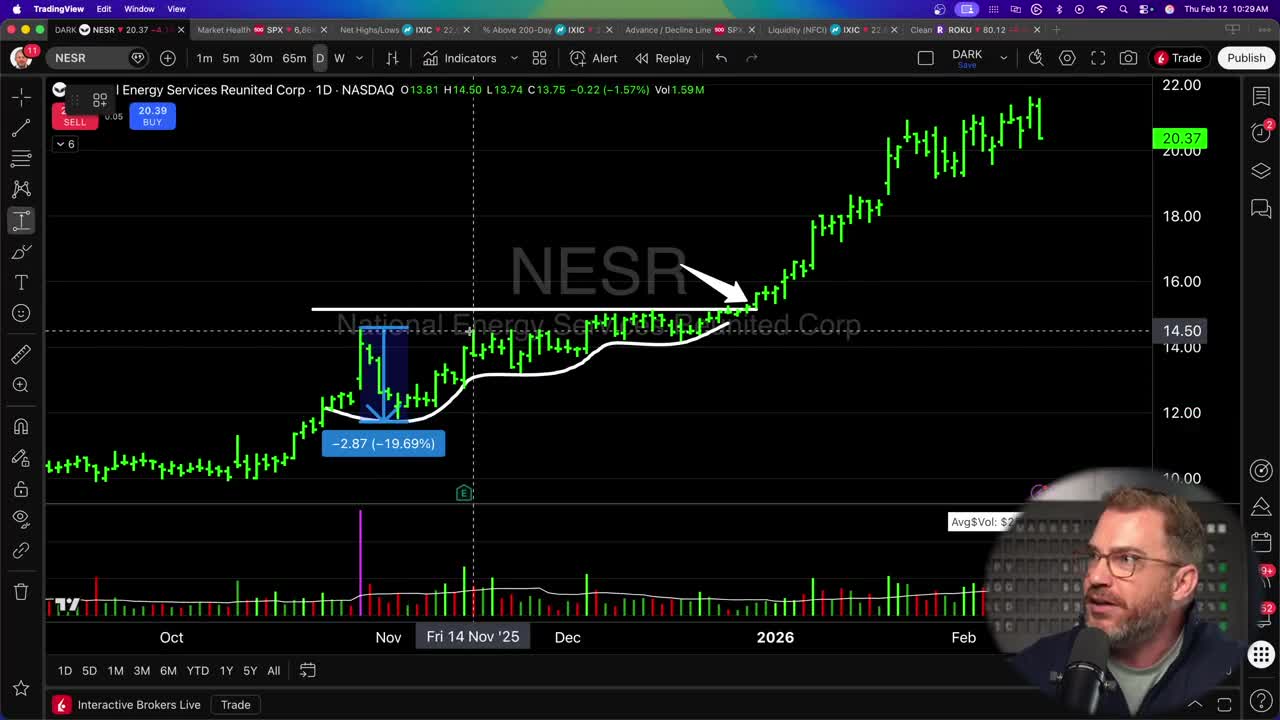
This creates a pattern where each pullback becomes less extreme.
- First Dip: About 20%
- Second Dip: Around 9%
- Third Dip: Tightens to about a 5% range
This shallowing effect shows you that the stock is becoming harder to buy. There are fewer and fewer sellers in each wave. The supply is being “gobbled up” by institutions building their positions.
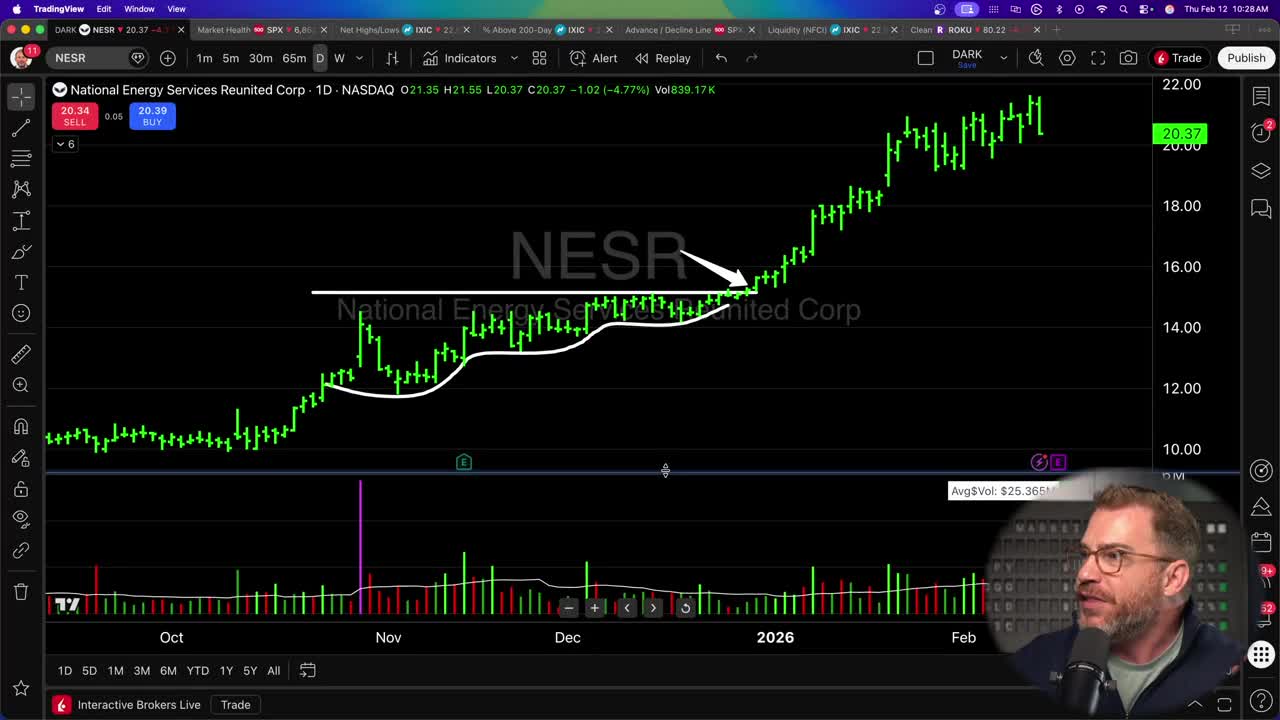
The volume during the consolidation phase is roughly the same as it was before the big move. The supply has been sucked out of the stock.
When the stock tightens up into that sub-10% range, the weak hands are gone. The stock is ready to release its energy and go for the next run.
Get an entire year of live weekly mentoring sessions, my newsletter, indicators, bonus reports, tons more. Click the link and I’ll see you in the next live session.
The Mathematics of Winning
This pattern doesn’t just tell us when to buy. It tells us exactly how to manage risk.
We’ve all heard the phrase “big risk, big reward.” That is insanely wrong. Not even close to true.
I rarely, if ever, risk more than 10% when buying a stock.
The shallowing pattern allows you to keep your risk incredibly tight. We can draw a line at the low of the consolidation pattern. We know the stock should not go back beneath that level if the institutional demand is real.
The Setup
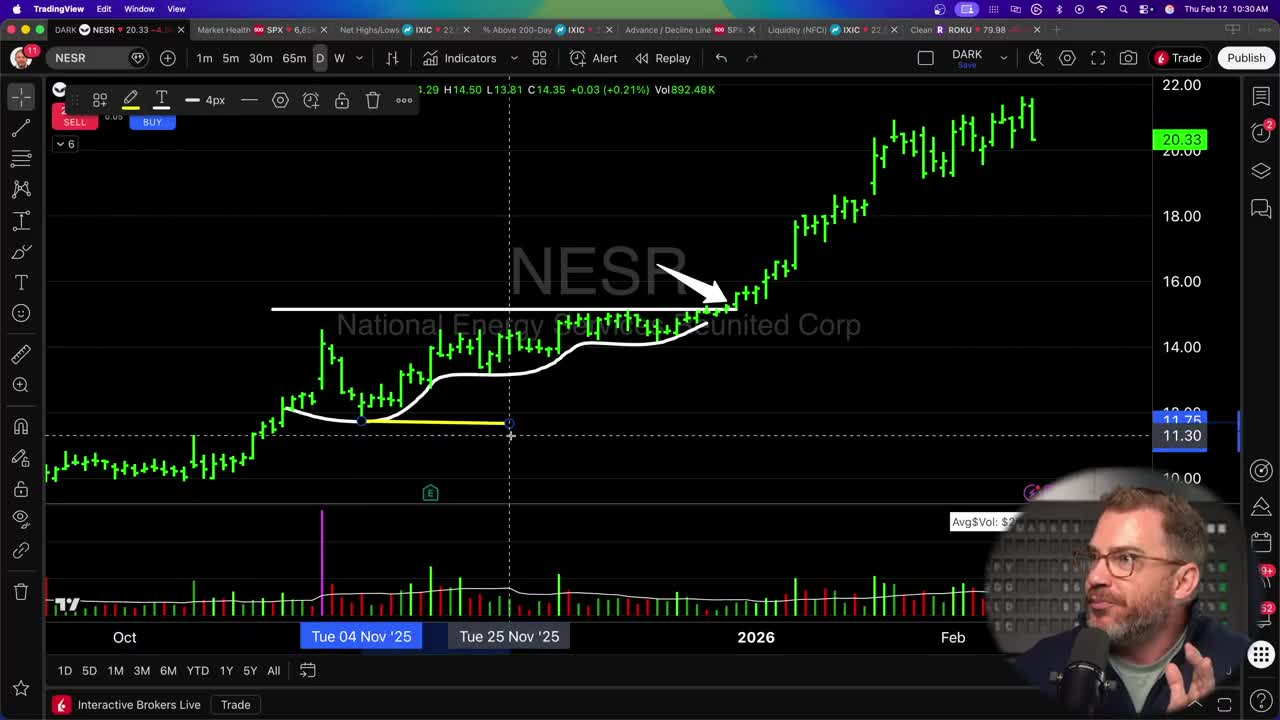
Entry: Buy on the breakout of the tight consolidation.
Stop-Loss: Place a sell stop order right at the swing low of the pattern.
In the NESR example, if you buy at $15 and a quarter, you set your stop at $14. That means you’re only risking about 7% on the trade.
However, the upside was a run to about 37%—in just three and a half weeks.
You have to think of every investment in terms of how much you’re trying to make on the dollars you’re risking. My goal is to risk one dollar to try and make three or four.
This math changes depending on your timeframe, but the principle remains the same:
- Day Traders: Might risk 1% to make 3-4%
- Swing Traders (Me): Risk 5-10% to make gains over 2-8 weeks
- Value Investors (Buffett): Might risk 30-40% to make 200-300% over years
Your reward must always be a multiple of your risk. Because we use the shallowing pattern, we know exactly where the price “should not go,” allowing us to keep that risk in the 5-10% range.
Follow the Leading Themes
You now have the pattern. But there are five, six, 7,000 publicly traded companies out there. Nobody wants to go through all those charts.
I have a shortcut.
You must focus on the leading areas of the market.
Every bull market historically has a theme. There will always be groups or sectors rising faster than others. Why? Because institutions don’t just wing it on single stocks. They invest from a macro point of view. They invest thematically.
They might decide the opportunity is in the nuclear space because AI has a power bottleneck. Or they might decide semiconductors are the play, which is why we saw Nvidia, Super Micro, and AMD run.
Applying the shallowing pattern to leading stocks in leading groups makes the strategy two, three, or four times as effective.
The Industry Strength Indicator
To find these themes, I use a tool called the Industry Strength Indicator on TradingView. It tracks 40 different subsectors and whittles the market down to the ones rising the most over 1, 3, 6, 9, and 12-month periods.
Recently, the data has been crystal clear. We’ve seen consistent leadership in:
- Gold Miners
- Rare Earth Metals
- Steel
- Mining and Metals
The “Mining and Metals” theme has been flashing green repeatedly. Gold, silver, copper, aluminum, and steel have all risen up. That’s because they’re all being bought by major funds.
Steal Wall Street’s Homework
Once you identify the sector—say “Mining and Metals”—you need to find the specific stocks to trade.
You don’t need to guess. You can use Exchange Traded Funds (ETFs) to find the best names.
An ETF is just a basket of securities. If you buy a Gold Miners ETF, it holds Newmont, Coeur, and all the major miners. The managers of these funds must report their holdings publicly. These are professional asset managers who have already done the research for you.
Just steal their stocks.
The Process
Google the Sector ETF: Search for “Mining and Metals ETF.”
Find the Ticker: XME is the State Street Metals and Mining ETF.
Look at the Holdings: Go to the fund’s website and click “Holdings.”
Download the List: You’ll see names like Coeur Mining, Alcoa, Freeport, Hecla, Royal Gold, and Newmont.
Sort by Weight: The stocks with the highest “weight” are the ones the fund managers believe in the most.
Take the top 10 to 20 names from that list and throw them into a watchlist. Now, instead of scanning 7,000 stocks, you’re focusing on the top 20 stocks in the strongest sector of the market.
Real-World Examples
When you apply this logic—leading sector plus shallowing pattern—the opportunities become obvious.
I created a “Mining and Metals” watchlist using this exact method, and the results speak for themselves.
Newmont (NEM)
Newmont showed the exact same pattern. It made a big move from $60 to $100. It came in and tightened, and tightened, and tightened. It broke out cleanly. The stock moved up 40% in 50 days and never went a penny against the trade.
Royal Gold (RGLD)
Royal Gold exhibited almost the exact same behavior. You see the leadership, you let it tighten up into a coil, you buy on the breakout, and you get a big acceleration higher.
ATI Inc. (ATI)
ATI wasn’t perfect, but the effects were the same. It had a big jump, loosened up, then tightened up nicely. It broke out cleanly through resistance, and if you bought it, you were up 30%.
This isn’t speculation. It’s pattern recognition.
I actually recommended NESR to my members two months ago right on the breakout. That position is up about 40% and counting.
The Four-Step Formula
Trading doesn’t have to be complicated. It boils down to a simple four-step process that anyone can follow:
1. Find good bull markets.
2. Identify the leading areas within that market using relative strength.
3. Laser focus on the top 10 to 20 stocks in those leading areas using ETF holdings.
4. Look for shallowing base breakouts to time your entry.
By following this, you can achieve big, fast gains while keeping your risk generally in that sub-10% range. This is the go-to bread-and-butter setup that can turn you into a profitable trader.
Get an entire year of live weekly mentoring sessions, my newsletter, indicators, bonus reports, tons more. Click the link and I’ll see you in the next live session.
DISCLAIMER: Traders Agency does not offer financial advice. The information provided is for educational purposes only and should not be considered financial advice. Traders Agency is not responsible for any financial losses or consequences resulting from the use of the information provided. Trading carries inherent risks and may not be suitable for all individuals. You are advised to conduct your own research and seek personalized advice before making any investment decisions, recognizing the potential risks and rewards involved.