The BTC (BTC) digital currency futures market remains in a long term up trend on the monthly time frame.
There is still a down Gartley Fibonacci extension price at 10,300, which we are expecting will be hit near the up trend line.
If or when that future low price is hit, it should U-turn the market and send the price back towards all-time highs.
However, BTC has been moving sideways since July, so let’s check in an see where it currently stands…
The Future of BTC?
Here’s how the chart is shaping up and how we see the market developing…

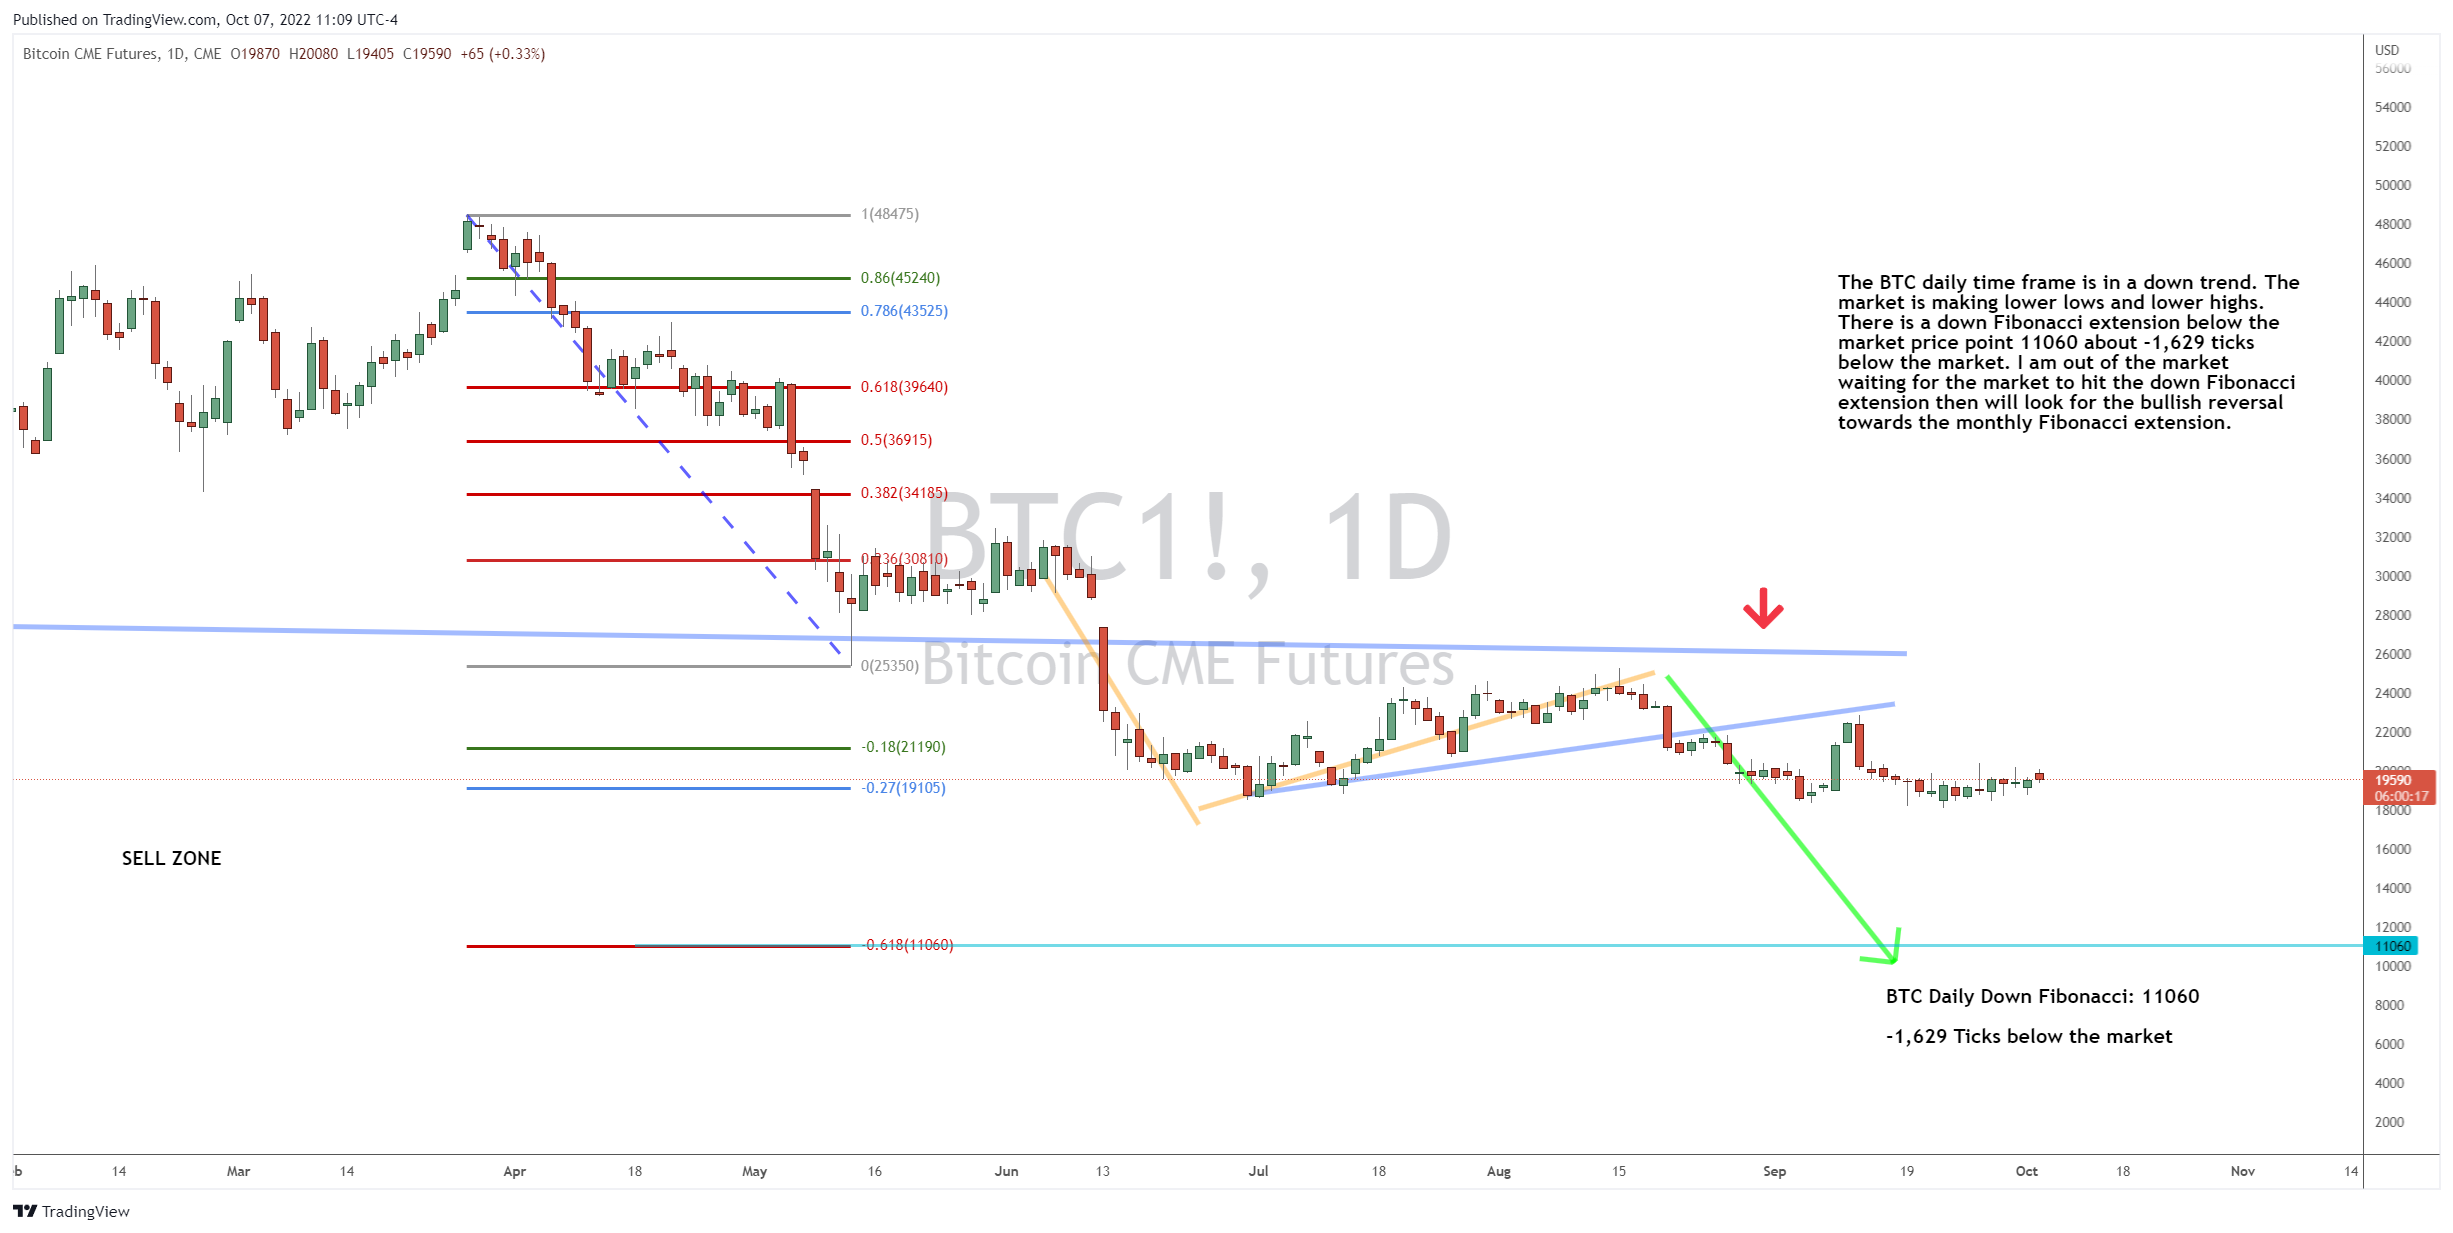
The BTC daily time frame is in a down trend. The market is making lower lows and lower highs.
There is a down Fibonacci extension below the market price point 11,060, about -1,629 ticks below the market.
For now, we are out of the market waiting for the market to hit the down Fibonacci extension.
Then, we will look for the bullish reversal towards the monthly Fibonacci extension of 76,555.
The Bottom Line
There are multiple ways to trade the futures, stock and other markets. We can trade the indexes, both up and down, as well as individual stocks.
But with inflation on a fast-track, you need to know how to amplify your gains. To see how I do it, check out the link in the P.S. below…
For more on the markets as well as trading education and trading ideas like this one, look for the next edition of Josh’s Daily Direction in your email inbox each and every trading day.
I’ll be bringing you more of my stock and futures contract trading tutorials as well as some additional trading ideas.
And if you know someone who’d love to make this a part of their daily trading routine, send them over to joshsdailydirection.com to get signed up!
Keep on trading,

P.S. Trading is not just a great job for building a portfolio… It can also act as the foundation for a side job for the right trader.
To learn more on how you might build a side job from trading, I have put together a special tutorial.
The post The Big Picture for BTC appeared first on Josh Daily Direction.


