
Hey, Ross here:
As we put February in the rearview mirror, it’s time to put the market in perspective.
Chart of the Day
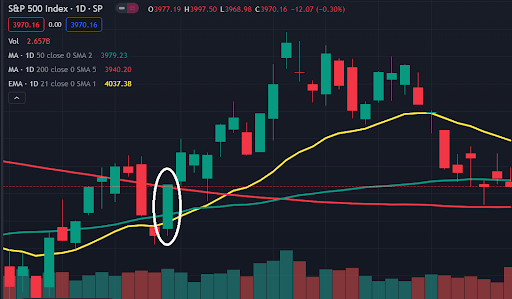
Yes, February was a painful month for many investors. But look at the above chart of the S&P 500. See that red line? That’s the 200-day moving average.
Now, notice that since January 20 (represented by the white circle), the S&P 500 has closed above the red line. That also means it spent the entire February trading above its 200-day moving average.
More context – if we look back all the way till 1950, every time the S&P 500 entered bear market territory then bounced back above its 200-day moving average for a month, it has NEVER made new lows.
In short, just like how a “painful” February is now in the rearview mirror – new lows are likely also in the past.
P.S. Want special trade prospects and potential market moves sent directly to your phone from me? Then just text the word ross to 74121.
Insight of the Day
Instead of getting swayed by the noise, look for the evidence in the price action.
Instead of getting swayed by the noise, look for the evidence in the price action
The mainstream news, the market chatter from friends, family, and acquaintances – all these create noise that can negatively impact your trading.
Instead, look for the evidence in the price action. That’s what I do – and it’s paid off well. Even as the entire market pulled back, I’ve been spotlighting numerous lesser-known stocks that have defied the market with strong uptrends and potential breakouts.
If you want to ignore the useless pundits, cut out all the noise, and just focus on what matters – then be sure to check this out. It’s my strategy for spotting potential high-flying winners by leveraging the biggest players in the market – institutional investors.
Ross Givens
Editor, Stock Surge Daily


