Hey, Ross here:
A brand-new trading week is here. So let’s look at an interesting chart that helps decipher what really went down in the markets last week.
Chart of the Day
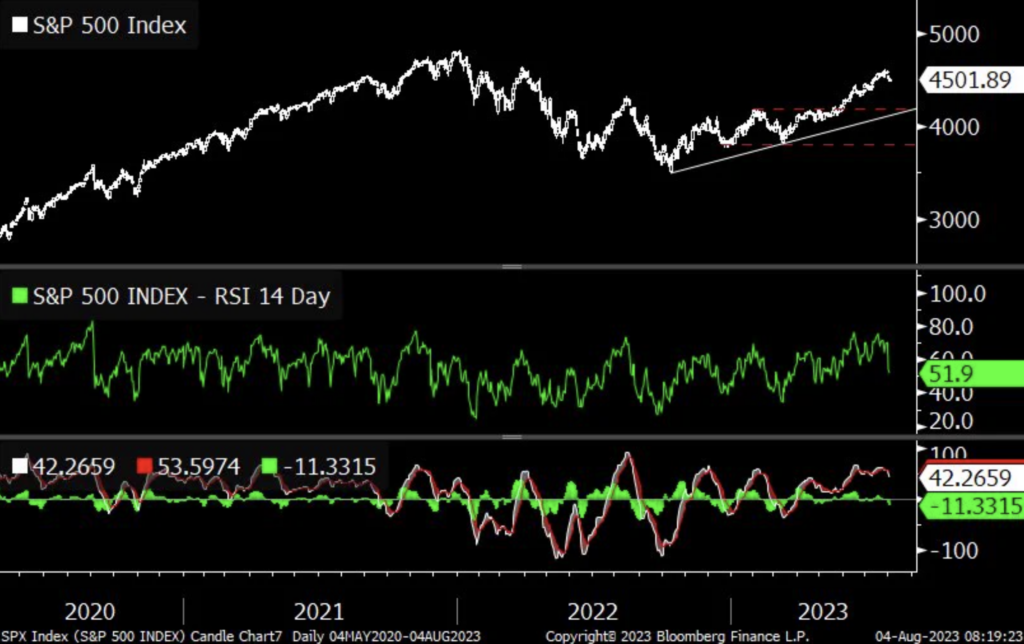
The above chart – courtesy of Bloomberg’s Chief Equity Strategist – shows the 14-day Relative Strength Index (RSI) for the S&P 500.
The RSI measures the speed and magnitude of the stock’s recent price changes and helps identify when it might be overbought or oversold.
Although you can’t see it clearly on the chart, the S&P 500’s RSI peaked in June and actually started gradually falling in July – even though the stock market kept rising.
This is called a bearish divergence, and it usually indicates a potential pullback on the horizon.
Well, we’re in the middle of that pullback now – something I said a couple weeks back was already overdue.
In short, this pullback is 100% natural. Don’t panic.
Insight of the Day
If a strategy worked the last time, there’s absolutely nothing wrong with using it again.
Or as the cliche goes – if it ain’t broke, don’t fix it.
What this means is, if a strategy worked the last time in a certain condition, there’s nothing wrong in using it again when a similar condition appears.
You don’t have to try anything new (in fact, that’s how most traders fail).
The last time the market pulled back, I used my FIRE Pattern strategy to target stocks that could have handed you gains of 50–100+% in weeks.
And with the market pulling back again, I believe the window of opportunity to repeat those gains is now wide open.
So, if you don’t already have access to my FIRE Pattern…
Embrace the surge,
Ross Givens
Editor, Stock Surge Daily