Good morning, Traders!
The Nasdaq 100 e-mini futures market (NQ) has finally broken the counter trendline and is entering bullish territory in the buy zone! I’ve been watching this market for some time, as it kept getting closer to that counter trendline. Now, as our timeframe analysis will show, the market has pushed into the buy zone!
Today’s analysis will show you why trendlines are so important. If we ignore them, we’ll miss plenty of opportunities to make money in the market. They also keep us from making bad trades when a market trend turns downward. That’s why you need to make sure you know how to draw proper trendlines!
As I follow the NQ, you’ll learn how to set up and execute an entry strategy for trades like this one. But you need the timeframe analysis to make it happen. So, let’s get started:
Daily Timeframe Analysis
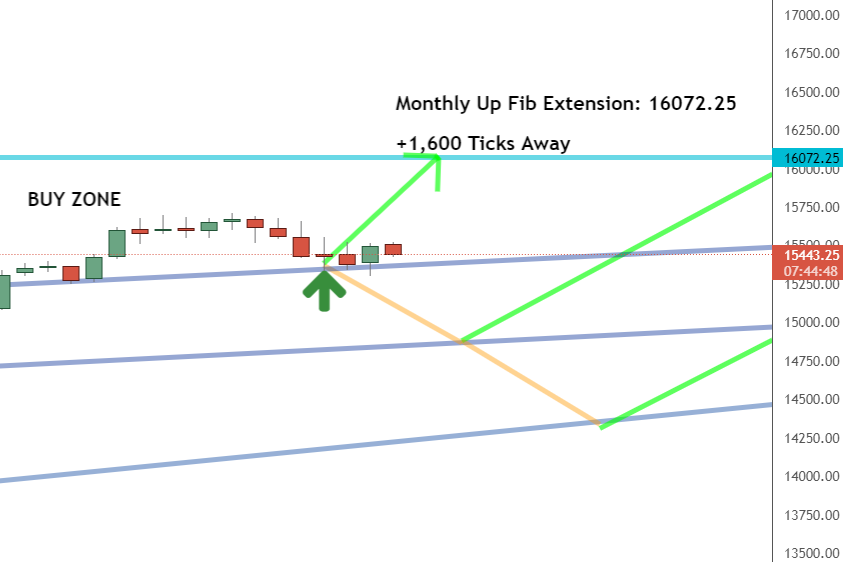
The daily timeframe shows that the overall direction for the NQ remains up. The market is making higher highs and higher lows as it pushes to a new high price.
The market will continue to trade in waves along the upward trend.

The long-term direction is up for the NQ

The short-term direction of the NQ is currently up

The NG finally broke through the counter trendline
Learn more about the Daily Direction Indicators here…

The overall direction for the NQ remains up as the market makes higher highs and higher lows
Don’t forget that we use the daily timeframe to find the high and low prices for a market before determining how to implement our entry strategy. We use it in conjunction with the one-hour timeframe to get a complete picture of the market’s movements.
One-Hour Timeframe Analysis
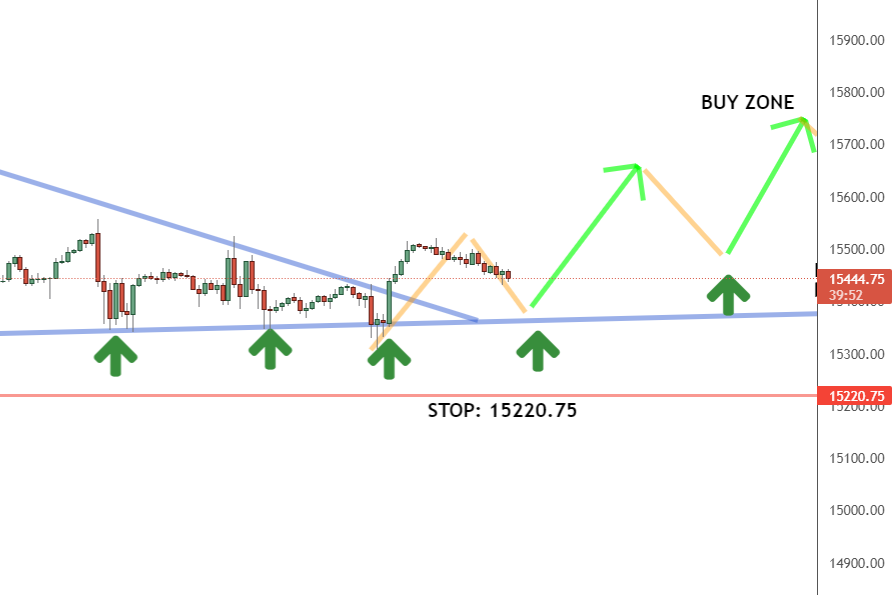
The NQ has finally broken through the counter trendline in the one-hour timeframe and is moving through the buy zone toward a higher price.
That’s the good news we’re always waiting for! Counter trendline breaks tell us that the market is swinging back toward a bullish push and will continue to climb. We want these bullish pushes so we can buy the market at a low price before it takes off toward the next up Fibonacci extension.

The NQ finally broke the counter trendline and is now in the buy zone. We can look for opportunities to enter the market
It’s important to remember that the market moves in waves. We’ll see numerous highs and lows as the market makes an overall upward push toward the next high price. To maximize our profit potential, we aim to take advantage of the market’s low pricing within the buy zone.
The Bottom Line
We can use our timeframe methodology to implement our market entry plan now that the NQ has moved beyond the counter trendline and into the buy zone. We’ll want to keep an eye on price movement inside the buy zone so that we can buy at a low while the NQ rises in price. While we’re in the NQ, we’ll want to keep an eye on our one-hour timeframe to monitor how prices move.

We’ll monitor the NQ as it starts to move through the buy zone and push bullish to a new high price
And none of this knowledge will be useful until you know how to put my plan into practice! So quit putting it off and get started immediately. If you keep waiting, these opportunities will pass you by as you warm the bench!
Keep On Trading,

Mindset Advantage: Accept
It’s not the market. It’s not your indicator. It’s TRADING.
Let it go. The first step toward consistent profits comes when you accept the reality that losses will occur. Prices have a mind of their own at times. The institutions are at the wheel. The sooner you accept this, the more progress you’ll make.
Look at the past, but don’t stare. Accept what’s happened and move on.
Target tighter entries. Get the heck out of those losers you’re hanging on to.
Accept. And start to enjoy trading.
Traders Training Session

Trading Longer Time Frames vs Shorter Time Frames Tutorial
Stay tuned for my next edition of Josh’s Daily Direction.
And if you know someone who’d love to make this a part of their morning routine, send them over to https://joshsdailydirection.
The post This market just made a critical move appeared first on Josh Daily Direction.


