Good morning, Traders!
Things continue to look up for the Nasdaq futures market (NQ). Both the short-term and long-term directions are up. But as the market gets closer to the top of the channel, we need to prepare for a retracement.
A retracement is simply a temporary drop in market price after a rally. When the market hits resistance, the price turns back down towards support.
Sometimes these sell-offs are short and involve a quick turnaround back to a bullish rally. But there’s also a chance of a sell-off turning into a bearish trend. How do you pick up on all of these possible directions for the market? Be sure to watch this training video I made on finding market patterns to learn more!
Our timeframe charts are the best tools to help us follow these changes in market price direction. Let’s take a look at the timeframe analysis for the NQ to see what’s in store for the market!Daily Timeframe Analysis
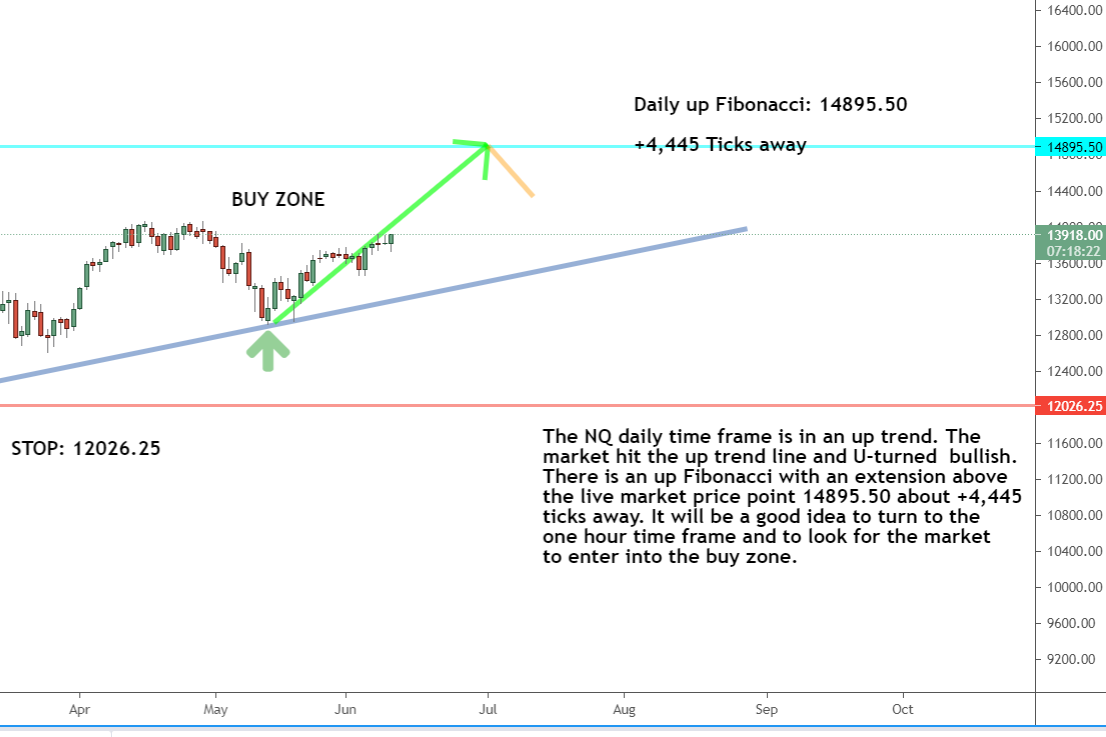
If we look at the NG’s daily timeframe chart, it’s clear that the overall direction is up, but the price movement is a bit sideways-ish. I’d like to see a bit more upward movement within the daily timeframe.DAILY TIMEFRAME

The direction within the daily timeframe is up
1-HR TIMEFRAME

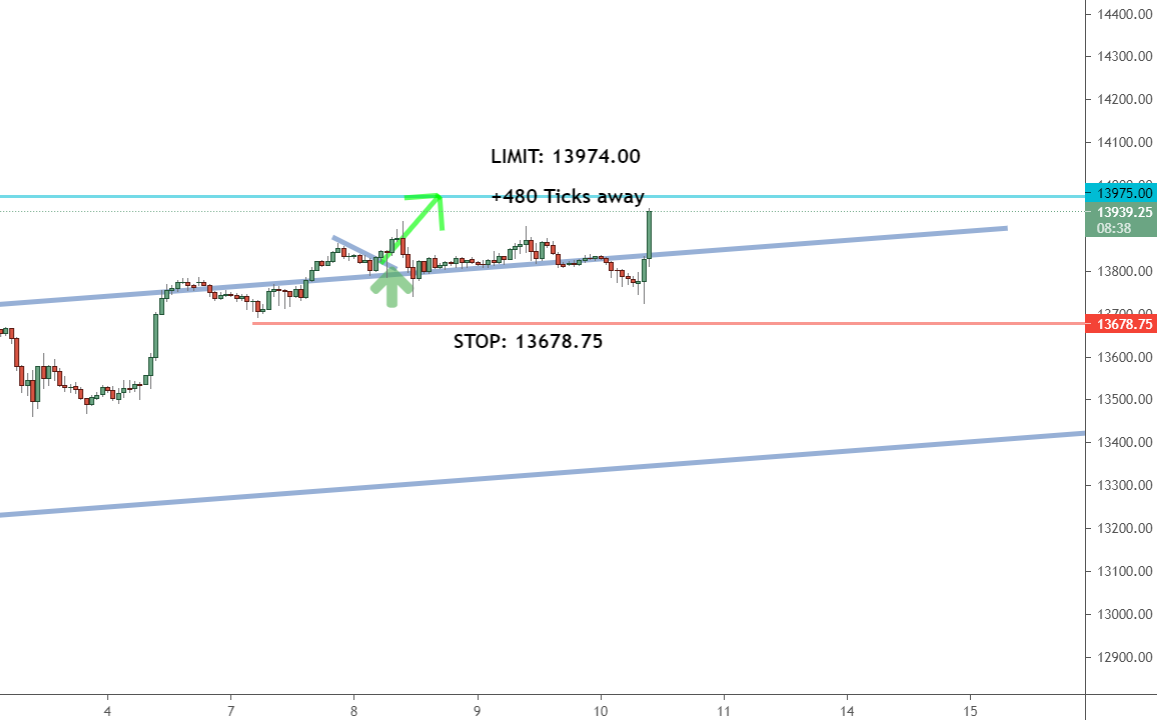
The current direction for the one-hour timeframe is up
THE BOTTOM LINE

The U-turn direction remains up

The daily NG is still up, but needs to progress a bit higher or it risks slipping into a sell-off toward support (bottom grey line).
We need more positive movement upward if the rally is to be sustained. If we don’t see more progress, the market could slip into a retracement and dip back down toward support.
As we keep an eye on the daily timeframe chart, it would benefit you as a trader to study how candlestick charts and tick movements work. Read my article on the subject to gain a complete understanding of how these charts work!
| Recommended Link:We can’t believe why almost no one is talking about this. It’s potentially the BIGGEST investment news of the decade. Today, we’ll show you how accessing a little-known portal in your brokerage account… Is the key to potentially amassing a quick fortune. You can start with a minimum average investment of just $500… And turn it into a mind-blowing $50,000 payout! All because the Chicago Mercantile Exchange (known as the “Merc”), the giant 171-year old trading marketplace, effectively turned the investing world on its head. Overnight, they created a lucrative loophole so big it lets thousands of ordinary, hard-working Americans earn huge sums of extra cash. |
One-Hour Timeframe Analysis
The NQ has hit support in the one-hour timeframe analysis. Remember that support is the point where buyers begin to reenter the market, driving the price back up.
When we see that change from a bearish drop to support over to a new rally, we like to use counter trendlines to confirm that the price has started to push bullish and moved into the buy zone.

The NQ is holding near support (upper grey line). If the price drops below support, we could see a significant sell-off. If the price stays above support, we could see the short-term direction continue to move up.
This is an important point to watch in the NQ right now. If support holds, the market should continue to move up within the one-hour time frame. But if the price drops below support, that could trigger a significant sell-off until the price bottoms out.The Bottom Line
Both the short-term and long-term directions for the NQ are up. But turning to the one-hour timeframe reveals that the market is staying close to support.
If the price breaks through support, it could trigger a sell-off and a bearish trend for the short-term. If that happens, we’ll wait for the price to bottom out and rebound on a new support level.

Both the long-term and short-term directions for the NQ are up. We’ll want to keep an eye on the short-term, though, as the price could drop below support and trigger a bearish drop
Right now, we’ll keep watching the price movement and look for opportunities to enter the market at low prices within the buy zone!
Want to learn more about trading futures like the NQ? Check out my free trading materials to get started. You don’t want to miss out!
Keep On Trading,

Mindset Advantage: Move On
You know the feeling when a bad trade comes back to the forefront of your mind?
In an instant, a calm morning is now haunted by the specter of a terrible trading session from ages ago. Just when you thought you would never, ever, ever find yourself in that situation again.
It’s time to move on. Sure, mistakes happen, but the key to getting past errors and losses is first to embrace them. Own them and take them as they are. After all, they’re yours.
But then be sure to move on. Your future is brighter than your past.Traders Training Session


