Good morning, Traders!
While the long-term outlook for the RTY is positive, we’re expecting a pullback when looking at the short-term analysis for the market. That means it’s time to wait and see what the market does.
Whenever a market hits the top of a channel (the upper grey line in a timeframe chart), we can expect a price retracement (temporary price drop). When that happens, it’s best to wait for the new low price. And once we see the market U-turn from that low price back toward the top of the channel, we can look at our entry options.
We do that to prevent buying the market while the price is still dropping. That’s one of the quickest ways to lose money, and that’s the opposite of what we want to do!
It can get confusing as we watch the market constantly move up and down, so be sure to read my article on how I utilize my strategy to enter a futures market at the right time.
Now let’s dig into the timeframe analysis and see what’s happening with the RTY!
Daily Timeframe Analysis
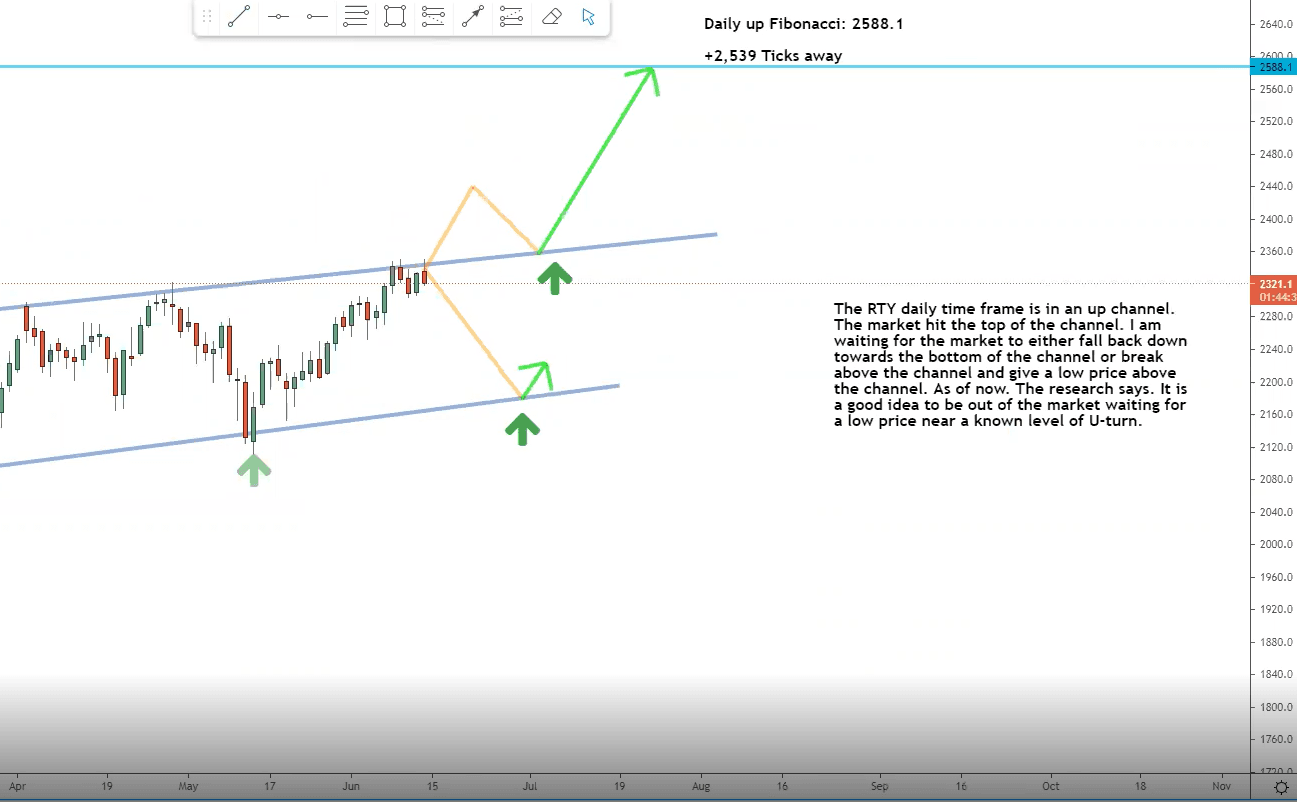
The daily timeframe shows that the RTY is still making positive moves to higher prices in the long run. But according to the chart, the price is getting close to the top of the channel (upper grey line). That means a sell-off wouldn’t be a surprise.

I’m still expecting a +2500 tick rally over the long term for the RTY. But the market has approached the top of the channel (upper grey line) which means we could see a bearish push to a lower price soon
Still, I expect the price to eventually make a bullish run to 2588.1 for a +2500 tick movement. Remember that tick movements make us money. Read up on how they work here.
One-Hour Timeframe Analysis
Whenever the market gets near the top of a channel (upper line in the chart below), we can expect a sell-off. The market has hit a point of resistance, buyers stop buying, and sellers take over. It’s a normal part of how the market works.
For the RTY, we see that pattern developing in the one-hour timeframe chart. The price has reached the top of the channel and is preparing for a bearish drop.

The RTY has hit the top of the channel (upper grey line) and is preparing for a bearish drop in price. The market could push past resistance and rally higher, but the likely scenario is a price drop toward the bottom of the channel (lower grey line) before the next rally.
While the price could push past the top of the channel, turning the backside of resistance into a new level of support, it’s likely that the price will drop within the current channel before rebounding back for the next rally.
This is where properly drawn trendlines are crucial to a successful trading strategy. Check out this free resource to learn how to draw market trend lines properly. Without them, your analysis won’t make any sense.
The Bottom Line
The long-term outlook for the RTY market is up, but the short-term is about to experience a bearish drop.
That’s not something that should bother us, though. The market trades in waves. We expect it to go up and down even when the overall trend is positive.
All we have to do is watch the one-hour timeframe and wait for the market to U-turn back toward the buy zone. That’s when we can utilize our entry strategy to buy the market on its way up. And that’s how we make money!
While the long-term direction for the RTY is up, we should prepare for a sell-off in the short -term
You now have what you need to plan your trades for the RTY, but do you know how to actually make money from them? I’ll show you how it all works! You just have to make the decision to get started.
Keep On Trading,

Mindset Advantage: Be Positive
Eliminate words like failure and loss.
It’s now all a learning experience.
That wasn’t a loss – just a new way NOT to do something.
That wasn’t a failure – just a way to manage expectations.
It’s ALL good.
Onward!Traders Training Session

See more from Traders Agency on Google
Make us a preferred source and our market analysis will appear more prominently in your Google Search, Top Stories, and AI results.
Add to Preferred Sources