
An earnings report is a quarterly disclosure of a company's financial performance, covering revenue, profit, and forward-looking commentary. Every public company has to release one, and learning to read it well is one of the most useful skills a new investor can build. By the time you finish this guide, you'll know exactly where to find these reports, what each section means, and how an SEC filing differs from an earnings press release so you stop missing the details that actually move stock prices.
You've probably seen this happen: a company "beats" earnings expectations, and the stock still drops 8% the next day. Confusing, right? The answer almost always lives inside the earnings report itself, in details a quick headline never captures.
That's exactly what we're going to teach you to find.
What Is an Earnings Report?
An earnings report is a formal update that publicly traded companies release four times a year, summarizing how much money they made, spent, and kept as profit over the prior three months. It's the primary way investors learn whether a business is growing, shrinking, or holding steady.
Companies are required to report this information because they sell shares to the public, and regulators want shareholders to have accurate, timely financial data. In the United States, that requirement comes from the Securities and Exchange Commission (SEC), which mandates quarterly and annual disclosures for all public companies.
Here's the part that trips up a lot of beginners: there isn't just one earnings document. There are two, released around the same time, and they are not identical. Understanding the difference between them is the real foundation of reading earnings the right way.
Key Concept: Every quarter, a company publishes a short press release (written by the company, for the public) and a full SEC filing (the legally required version with footnotes and risk factors). The headlines come from the first one. The truth usually lives in the second.
Where Do Earnings Reports Come Out?
There are three main places to find them:
- The company's own investor relations page on its website
- The SEC's EDGAR database, where official filings are posted publicly and free of charge: search EDGAR here
- Financial news and brokerage platforms, which usually republish the press release plus a summary
If you want the full, unfiltered document, EDGAR is the most reliable source. It's where the legally required filing lives, and it costs nothing to search.
What Is Included in an Earnings Report?
An earnings report typically includes three core financial statements plus management commentary: the income statement, the balance sheet, and the cash flow statement, along with a press release that summarizes results in plain language.
We'll define each piece, since these terms get thrown around constantly without explanation.
1. The Income Statement
This shows revenue (money coming in) at the top and net income (profit after all expenses) at the bottom. That's why you'll hear "top line" used for revenue and "bottom line" used for profit.
2. The Balance Sheet
A snapshot of what the company owns (assets) and owes (liabilities) at a single point in time, not over the full quarter.
3. The Cash Flow Statement
This tracks actual cash moving in and out of the business, which can tell a very different story than the income statement alone.
4. The Press Release and Earnings Call
The press release is a short, company-written summary highlighting the numbers management wants you to notice first. The earnings call is a live discussion, usually audio or webcast, where executives explain results and answer analyst questions.
How Do You Interpret an Earnings Report?
To interpret an earnings report, compare the actual results against three benchmarks: analyst estimates, the prior-year quarter, and the company's own prior guidance. A "beat" or "miss" only means something in the context of those comparisons, never in isolation.
Here's a concrete example. Say a company reports quarterly revenue of $4.2 billion, up from $3.9 billion a year earlier. That's 7.7% year-over-year growth, which sounds solid on its own.
But if analysts expected $4.4 billion, the stock may still fall, because the company missed the number Wall Street was already pricing in. That's why interpreting an earnings report correctly requires looking past the headline growth figure.
Earnings Per Share (EPS): Beats, Misses, and Guidance
Earnings per share (EPS) is net income divided by the number of outstanding shares. It's the single most-watched number in any earnings release, and the math is simple:
EPS = Net Income ÷ Shares Outstanding
Here's how that plays out with real numbers:
| Input | Value |
|---|---|
| Net Income | $500 million |
| Shares Outstanding | 250 million |
| Reported EPS | $2.00 |
| If Analysts Estimated $1.90 | Beat by $0.10 |
| If Analysts Estimated $2.15 | Miss by $0.15 |
Here's the piece most beginner guides skip: a beat today doesn't matter much if the company lowers guidance (its own forecast for future performance) for next quarter. A stock can beat on EPS and still drop hard if management signals slower growth ahead. That forward-looking guidance is often more important to the stock's next move than the quarter that already finished.
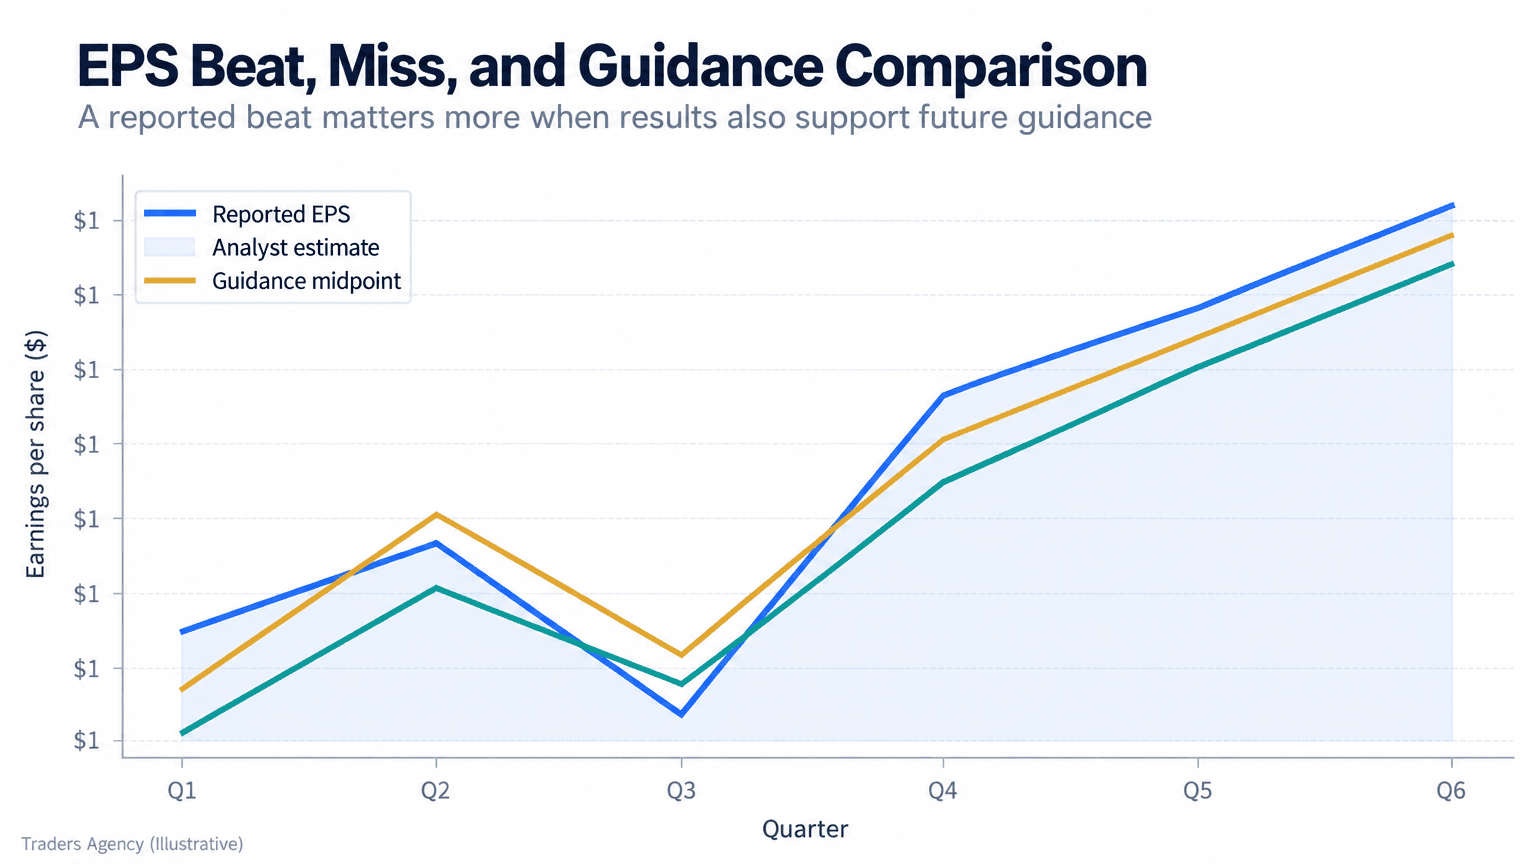
Notice in a chart like this how the gap between the estimate line and the guidance line often matters more than any single quarter's result. That gap tells you whether the market expects acceleration or deceleration from here.
Want expert trading insights delivered daily?
Join thousands of traders who rely on Traders Agency for market analysis and trade ideas.
Join Traders AgencyHow Does an SEC Filing Differ from an Earnings Press Release?
The core difference between an SEC filing and an earnings press release comes down to depth and legal accountability. The press release is a marketing-friendly summary written by the company. The SEC filing, called a 10-Q for quarterly results or a 10-K for annual results, is the complete, legally required disclosure.
We tell our members the same thing every quarter: never make a trading decision based on the press release alone.
Why the Difference Matters
A press release might say "revenue grew 12% with strong margin expansion." That can be perfectly true and still be carefully chosen language. The 10-Q or 10-K adds:
- Full financial statements with footnotes explaining unusual items
- Risk factors disclosing legal, competitive, or operational threats
- Detailed segment breakdowns by product line or region
- Management's discussion and analysis (MD&A), which is far more candid than the press release
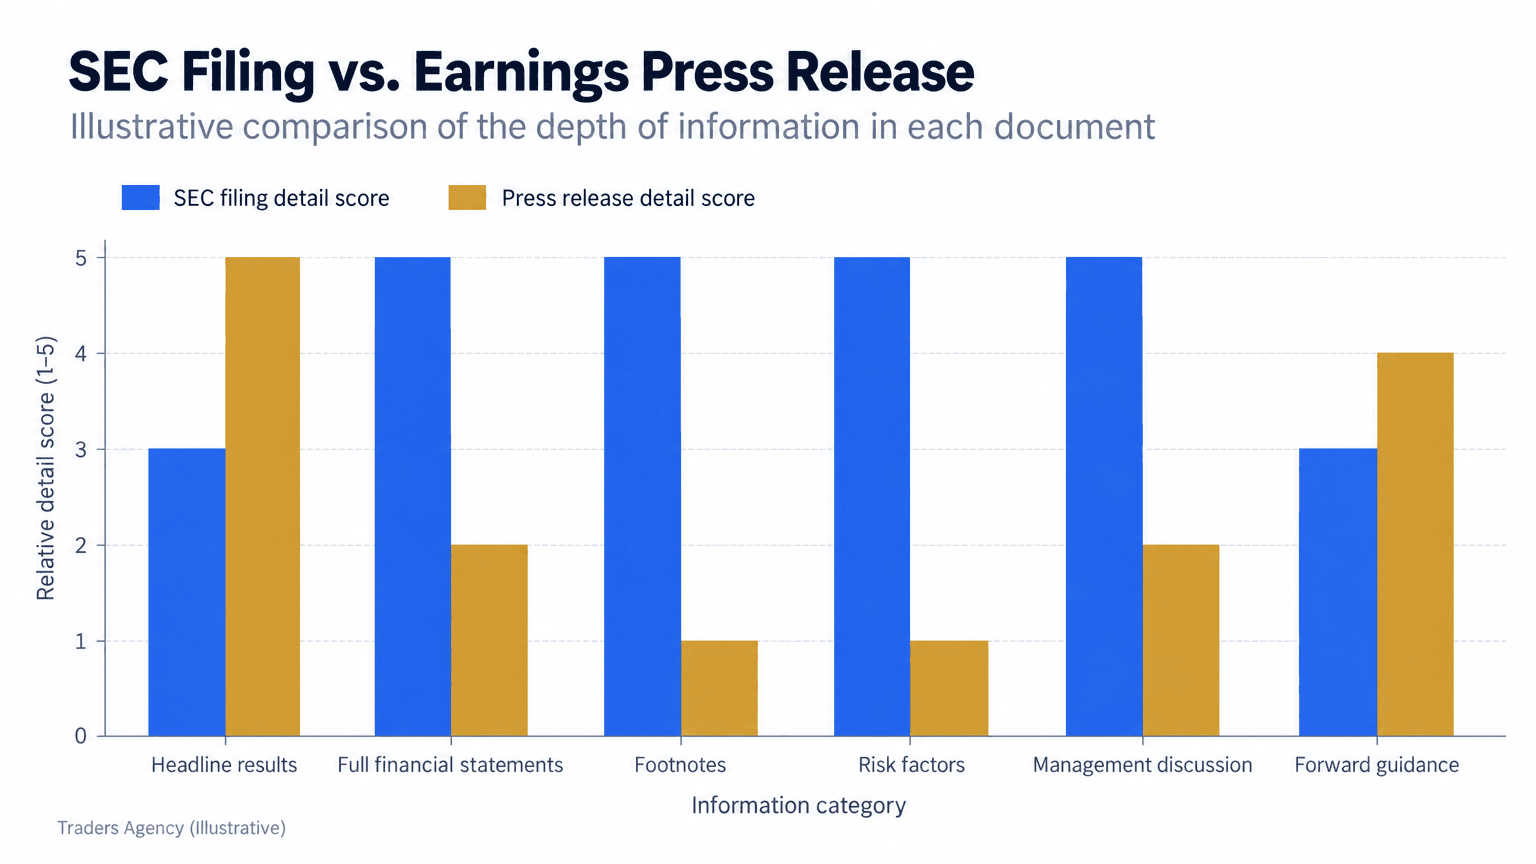
As you can see, the gap is widest in footnotes and risk factors, which is exactly where accounting issues and red flags tend to hide. Companies have no legal obligation to pack every uncomfortable detail into a two-page press release, but they do have that obligation inside the formal filing.
Watch Out: If a headline number looks great but the stock sells off anyway, assume the market read something you haven't. Check the footnotes, the segment detail, and any newly added risk factors before you decide the reaction was "wrong."
How to Read an Earnings Report PDF
Most 10-Qs and 10-Ks are posted as PDFs on EDGAR, and they're long. Don't start at page one and read straight through. Use this order instead:
- Jump to the income statement first for revenue and EPS
- Check the balance sheet for cash, debt, and inventory trends
- Review the cash flow statement to see how cash actually moved
- Read the MD&A section for management's own explanation of the results
- Scan the risk factors for anything newly added since the prior filing
That last step is the one almost nobody does, and it's often where the most valuable information sits.
How Does the Cash Flow Statement Support the Earnings Story?
A company can report positive net income and still be burning cash, which is why the cash flow statement carries so much weight. It reconciles accounting profit with actual cash movement, adjusting for non-cash items like depreciation and changes in working capital.
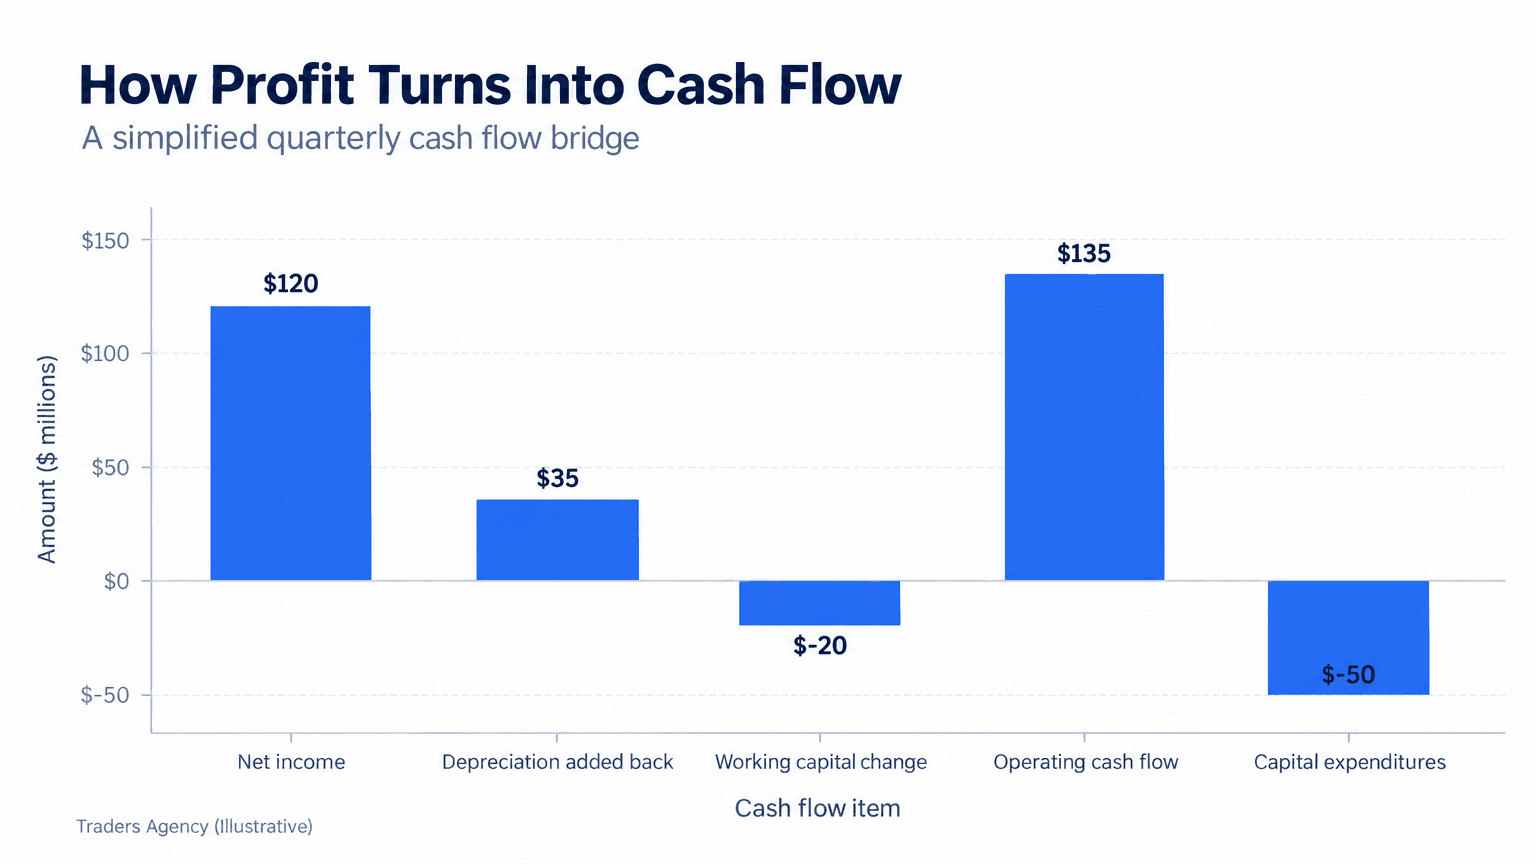
Here's an illustrative walk-through of how a strong headline profit can shrink fast:
| Line Item | Amount |
|---|---|
| Reported Net Income | $200 million |
| Operating Cash Flow (after depreciation and inventory build) | $180 million |
| Capital Expenditures | $150 million |
| Free Cash Flow | $30 million |
That's a very different financial picture than the headline profit number suggests, and it's a detail you'll only catch by reading past the press release into the full filing.
What "Good" Looks Like Varies by Sector
A software company with 70% gross margins is normal. A grocery chain with 70% gross margins would be extraordinary, and probably a reporting error. Context is everything:
- Retail and grocery: thin margins (2-5% net margin) are typical, so focus on revenue growth and same-store sales
- Software and tech: high margins (60-80% gross margin) are expected, so watch subscription growth and cash burn
- Banks and financials: margin terminology works differently, so focus on net interest income and loan quality
- Industrials and manufacturing: moderate margins (8-15% net margin) are typical, with heavy attention on order backlogs
How Do You Read an Earnings Statement, Step by Step?
Here's the process we walk new members through, start to finish.
- Step 1: Find the report. Search the company's investor relations page or EDGAR. Note the exact release date and time, since many companies report before the market opens or after it closes.
- Step 2: Read the press release headline numbers. Write down revenue, EPS, and year-over-year growth, but treat them as a starting point, not a conclusion.
- Step 3: Compare against estimates and prior guidance. This is where real interpretation happens. A beat against analyst estimates paired with a miss against the company's own guidance is a yellow flag.
- Step 4: Open the full SEC filing. Work through the income statement, balance sheet, and cash flow statement in that order, hunting for anything the press release skipped.
- Step 5: Check the earnings expected move. Options markets price in an expected move, the size of the price swing options traders anticipate after the release, based on implied volatility. If a stock's expected move is plus or minus 6% and it only moves 2%, the result was largely anticipated, and options traders had priced in more volatility than actually showed up. You can review how options exchange data reflects that expected volatility.
- Step 6: Listen to highlights from the earnings call. You don't need the whole thing. Focus on the prepared remarks for strategy commentary and the Q&A section for analyst pushback on the weak spots.
Should You Buy Stock Before or After the Earnings Report?
We generally caution newer investors against making trading decisions built purely around an upcoming earnings date. Earnings reports bring a sharp, sudden jump in volatility that can move a stock significantly in either direction within minutes.
Buying right before a report is essentially a bet on an unknown outcome, since even strong companies can disappoint on a single line buried in guidance. Buying after the report, once you've actually read the filing and understand the story behind the numbers, is the more informed choice. You won't catch the very first price move, but you'll be replacing a guess with real analysis.
Watch Out: Holding a position through earnings exposes you to overnight gap risk, and no stop-loss order protects you from a price that opens below your exit level. Size the position accordingly, or wait for the report.
Work through two or three filings this way and the process gets fast. The goal isn't to read every page, it's to know which pages matter.
Want expert trading insights delivered daily?
Join thousands of traders who rely on Traders Agency for market analysis and trade ideas.
Join Traders AgencyDISCLAIMER: Traders Agency does not offer financial advice. The information provided is for educational purposes only and should not be considered financial advice. Traders Agency is not responsible for any financial losses or consequences resulting from the use of the information provided. Trading carries inherent risks and may not be suitable for all individuals. You are advised to conduct your own research and seek personalized advice before making any investment decisions, recognizing the potential risks and rewards involved.
See more from Traders Agency on Google
Make us a preferred source and our market analysis will appear more prominently in your Google Search, Top Stories, and AI results.
Add to Preferred Sources