
RSI, or the Relative Strength Index, is a momentum indicator that measures the speed and size of recent price moves on a scale of 0 to 100. Traders use it to spot when an asset might be overbought or oversold, and to confirm or question the strength of a trend. Using RSI well means understanding what the number actually tells you, not just reacting the moment it crosses a line.
You have probably seen this play out: a stock prints an RSI reading above 70, someone calls it "overbought," and then price keeps climbing for another two weeks. That is not a broken indicator. That is a misunderstanding of what RSI measures.
By the end of this guide, you will know how to calculate RSI, read its signals in context, spot divergence before a reversal shows up in price, and pair it with a second indicator like MACD for higher-conviction setups. We will walk through real number examples so you can apply this on your own charts, whether you use TradingView or any other platform.
What Is the Relative Strength Index (RSI)?
Bottom Line: RSI readings only mean something when read in context: an overbought or oversold number can stay extreme through a strong trend, so the signal needs confirmation from trend direction, divergence, or a second indicator like MACD before you act on it. Treat RSI as a tool for gauging momentum strength, not a standalone buy or sell trigger.
The Relative Strength Index is a momentum oscillator that measures how fast and how far price has moved recently, plotted on a 0 to 100 scale beneath your price chart. It was developed in the late 1970s and remains one of the most widely used tools in technical analysis today.
RSI does not measure price itself. It measures the momentum behind price moves, comparing the size of recent gains to recent losses over a set lookback period, typically 14 candles or bars.
Key Concept: RSI tells you who has been winning the recent battle between buyers and sellers, and how convincingly. High readings mean buyers have been pushing aggressively. Low readings mean sellers have had the upper hand.
Most charting platforms, including TradingView, display RSI in a separate panel below the price chart with horizontal reference lines marking the 30 and 70 levels.
Why RSI Works
Price does not move in a straight line forever. Momentum tends to build, peak, and fade before a trend actually turns.
RSI captures that fading momentum earlier than price action alone would show you. Think of it like a car's speedometer: the car (price) might still be rolling forward, but if the speedometer (RSI) is dropping fast, that tells you something about how long the current pace can hold.
What Is the Formula for Calculating RSI?
RSI = 100 - (100 / (1 + RS)), where RS is the average gain divided by the average loss over the lookback period, usually 14 periods.
Step-by-Step RSI Calculation
- Step 1: Track daily price changes over the last 14 periods, separating gains (up days) from losses (down days).
- Step 2: Calculate the average gain by adding up all the gains over 14 periods and dividing by 14.
- Step 3: Calculate the average loss by adding up all the losses (as positive numbers) over 14 periods and dividing by 14.
- Step 4: Divide average gain by average loss to get the Relative Strength (RS) value.
- Step 5: Plug RS into the formula: RSI = 100 - (100 / (1 + RS)).
Here is a worked example. Say that over 14 days, the average gain on up days was $1.20 and the average loss on down days was $0.60.
| Input | Value |
|---|---|
| Lookback period | 14 days |
| Average gain (up days) | $1.20 |
| Average loss (down days) | $0.60 |
| Relative Strength (RS) | 2.0 (1.20 / 0.60) |
| RSI calculation | 100 - (100 / (1 + 2.0)) = 100 - 33.3 |
| Final RSI reading | 66.7 |
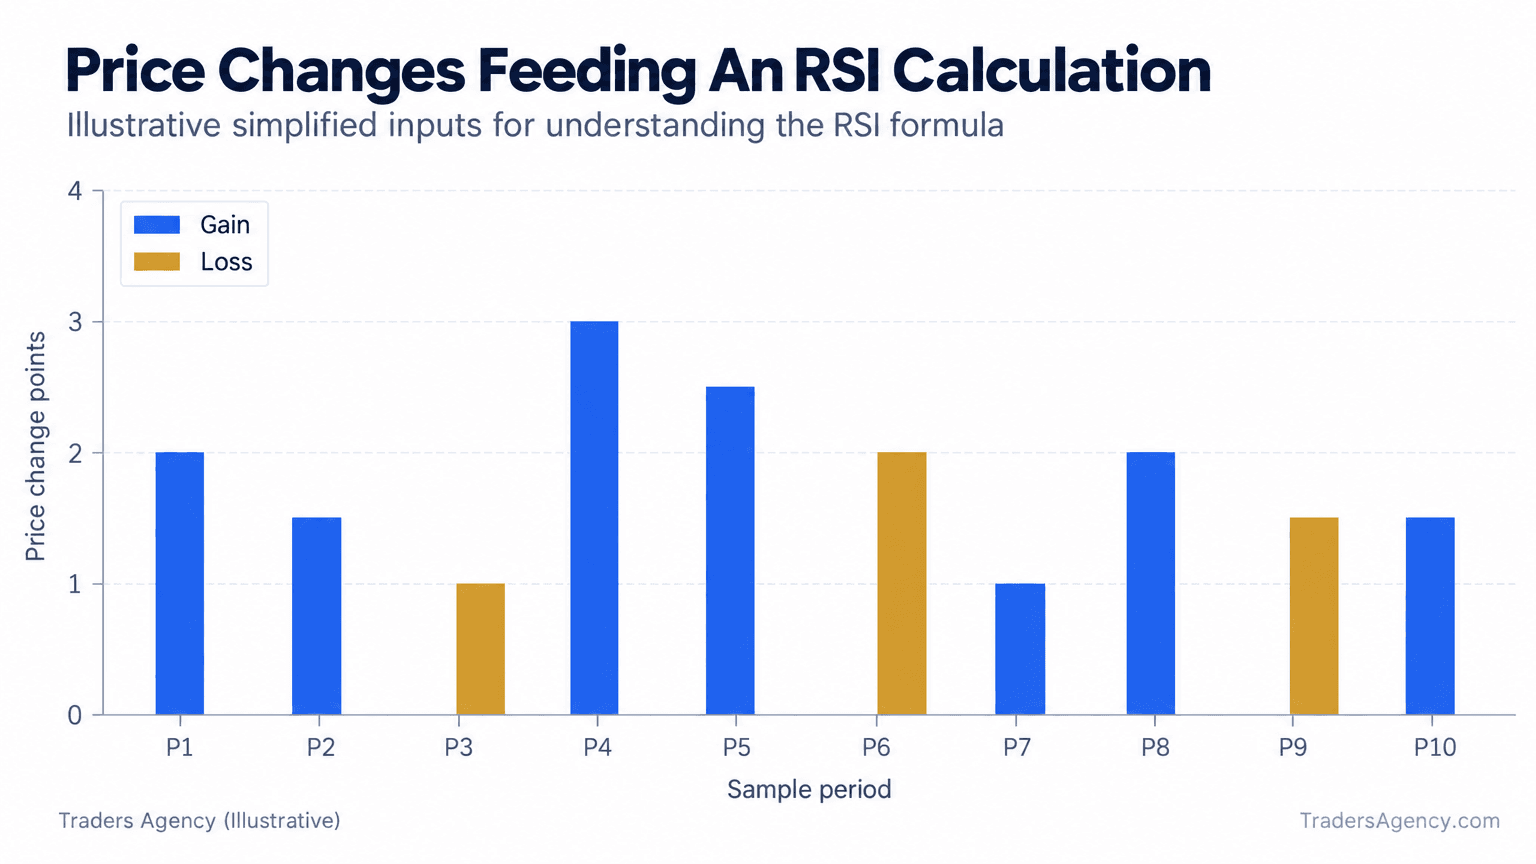
The good news: you will almost never run this math by hand. Every major charting platform automates it. Understanding the formula simply helps you interpret why the number moves the way it does.
How Do You Use RSI?
To use RSI, watch for readings above 70 (potentially overbought) or below 30 (potentially oversold), then look for confirmation from price action, trendlines, or a second indicator before acting. We teach RSI as a timing tool, not a standalone trade signal.
Here is what the standard reference zones mean:
- RSI above 70: Price has risen fast enough that momentum may be stretched. Often called "overbought."
- RSI below 30: Price has fallen fast enough that momentum may be stretched to the downside. Often called "oversold."
- RSI near 50: Momentum is roughly balanced between buyers and sellers.
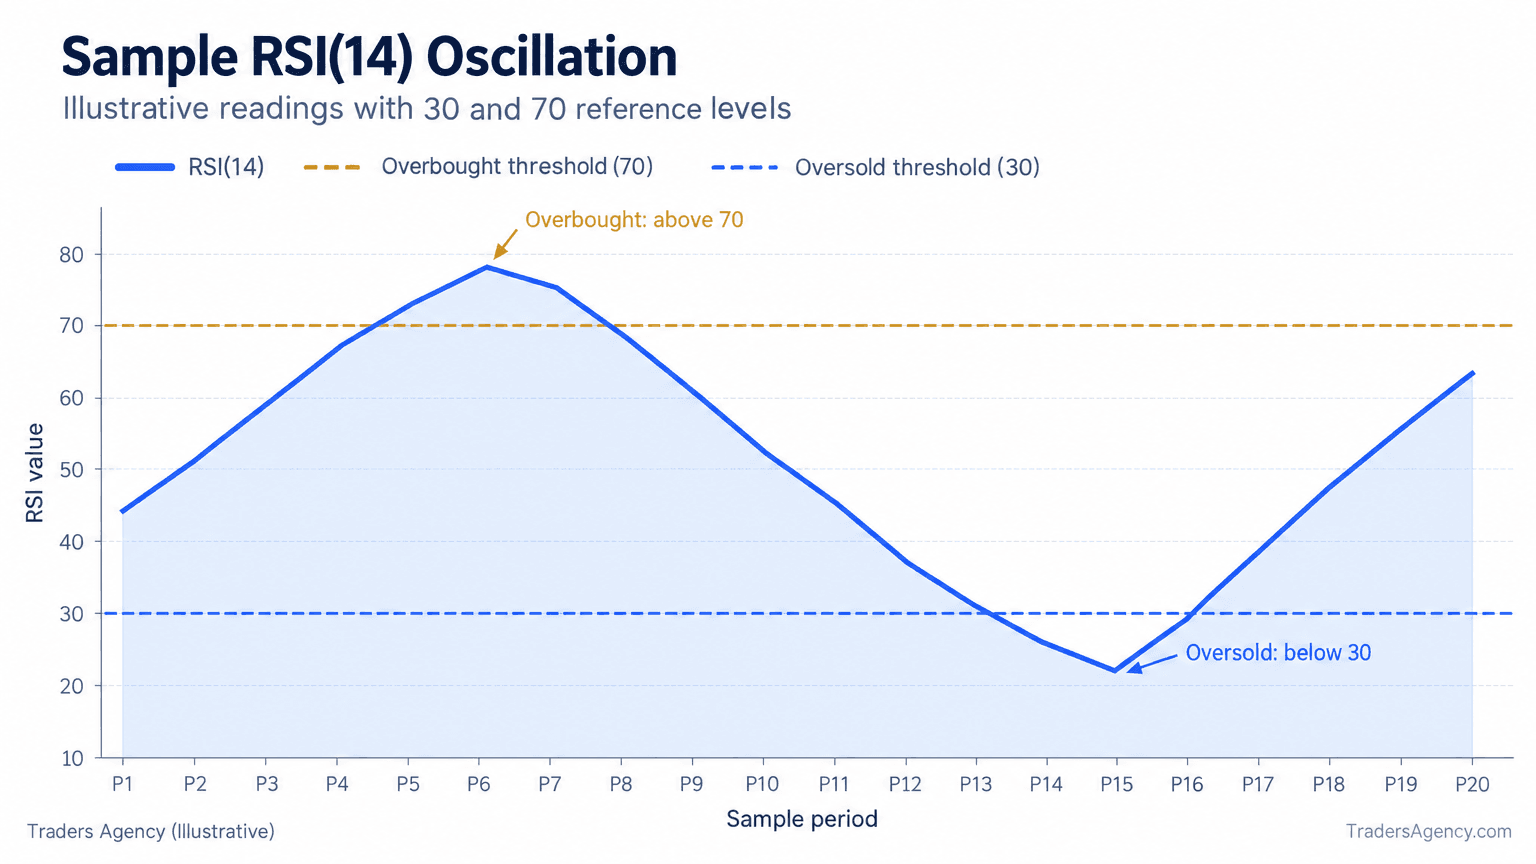
For newer traders, the most useful starting point is waiting for RSI to cross back below 70 (a possible sell signal) or back above 30 (a possible buy signal), rather than acting the instant it touches those lines. That distinction matters more than almost anything else in this guide.
Why Overbought and Oversold Are Not Automatic Signals
This is the single biggest mistake we see new traders make with RSI. An overbought reading does not mean "sell now," and an oversold reading does not mean "buy now."
Watch Out: In a strong uptrend, RSI can sit above 70 for days or even weeks while price keeps grinding higher. Selling every overbought reading in that environment means exiting winning trades far too early, over and over.
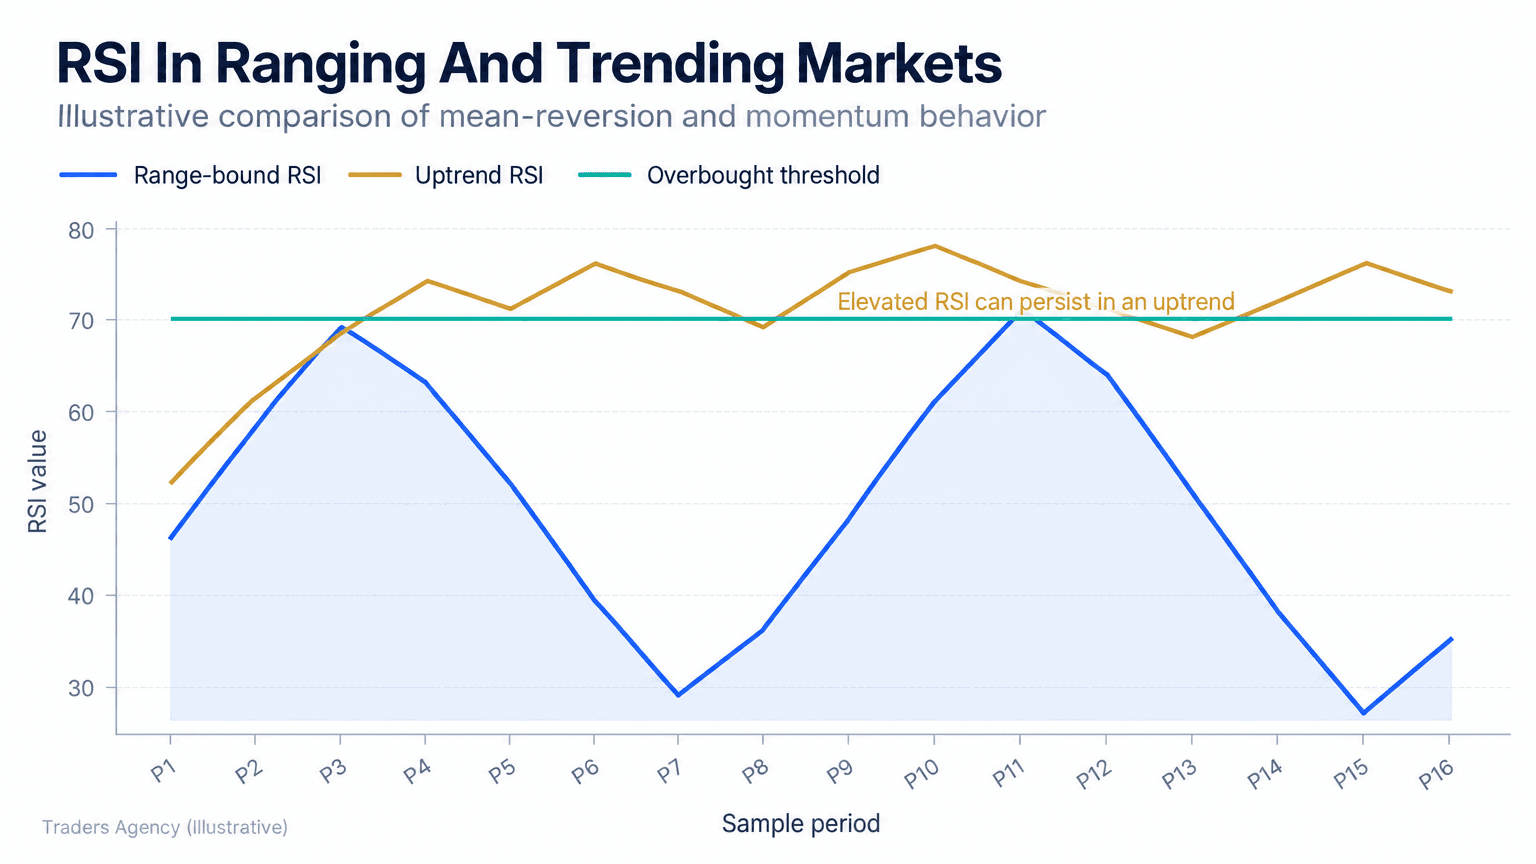
RSI readings mean different things depending on whether the market is ranging or trending. In a sideways, rangebound market, the 30/70 bounce approach works reasonably well. In a strong trend, RSI will stay pinned near the extremes, and that is a sign of trend strength, not weakness.
Want expert trading insights delivered daily?
Join thousands of traders who rely on Traders Agency for market analysis and trade ideas.
Join Traders AgencyHow Do You Use RSI to Identify a Trend?
Beyond overbought and oversold levels, RSI helps confirm whether a trend has real momentum behind it or whether it is running out of fuel. The signal we lean on most here is divergence.
Divergence happens when price and RSI disagree: price makes a new high or low, but RSI fails to confirm it.
Bearish Divergence Example
Say a stock rallies from $48 to $52, forming a new high on the chart. During that first push, RSI peaked at 78. The stock then pulls back slightly and rallies again to $54, an even higher price high. This time, RSI only reaches 68.
| Swing | Price High | RSI Peak | Read |
|---|---|---|---|
| First rally | $52 | 78 | Strong momentum |
| Second rally | $54 | 68 | Higher high in price, lower high in RSI |
| Signal | Higher price high + lower RSI high | Bearish divergence | |
Price made a higher high. RSI made a lower high. That mismatch suggests the buying pressure behind the second push was weaker than the price chart alone made it look.
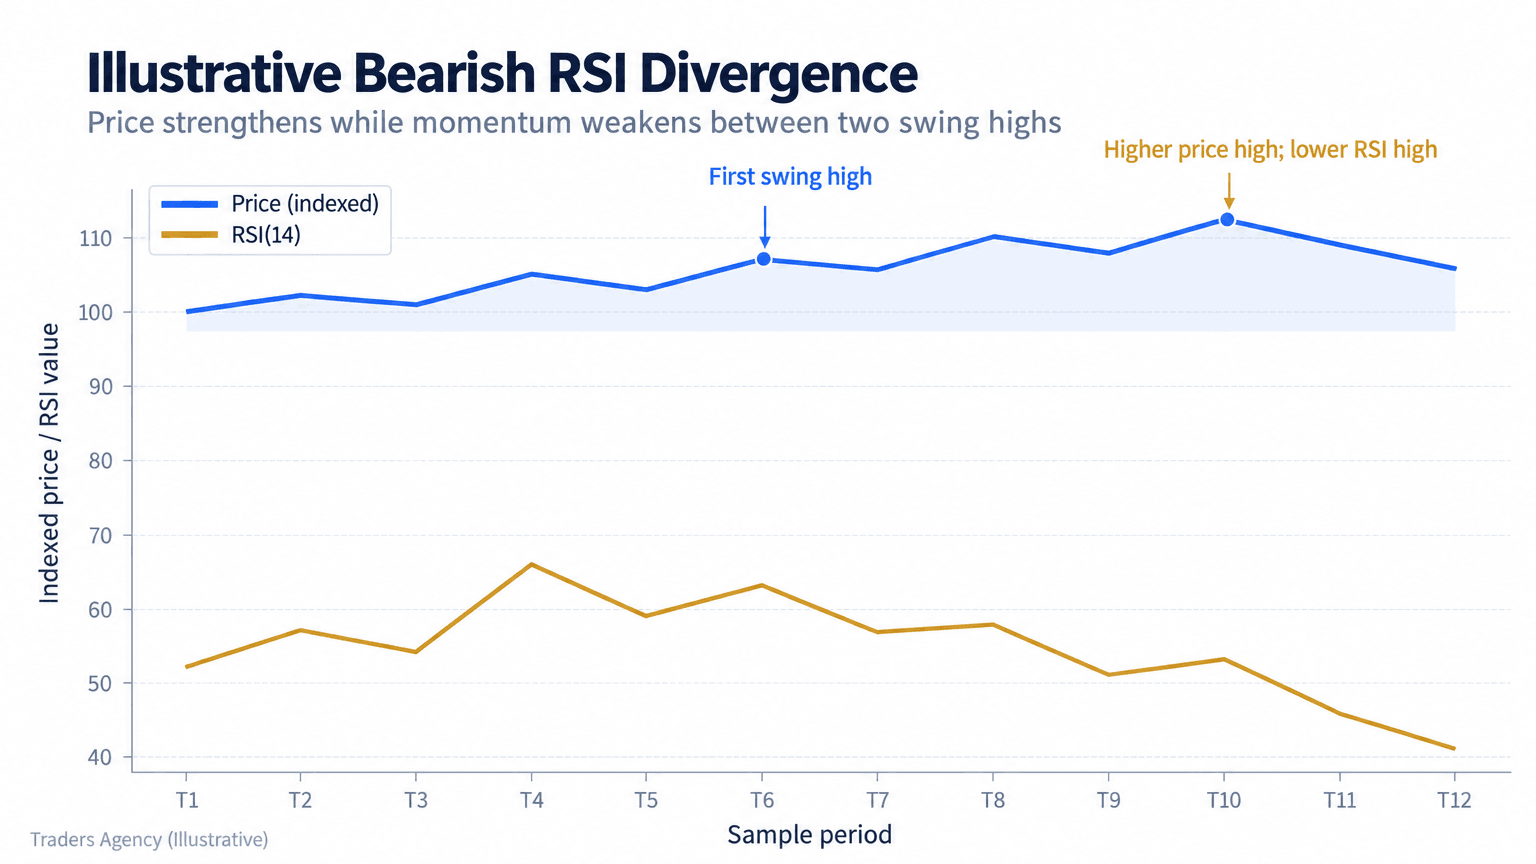
Bullish divergence works the same way in reverse: price makes a lower low while RSI makes a higher low, suggesting selling pressure is fading even though price has not turned yet.
Divergence is not a guaranteed reversal signal on its own. Our approach is to treat it as a warning to tighten risk management or wait for price confirmation, such as a broken trendline, before acting.
Is an RSI of 40 a Good Buy or Sell?
An RSI of 40 sits in neutral-to-slightly-bearish territory. It is not oversold (below 30) and not overbought (above 70), so it is not a standalone buy or sell signal. Context matters far more than the number itself.
In a strong downtrend, an RSI of 40 might mark a relief bounce that is about to fail, a spot where sellers are likely to step back in. In a strong uptrend, the same reading could represent a healthy pullback worth buying, since pullbacks in uptrends often bottom out in the 40 to 50 RSI zone rather than down at 30.
That is why the question "what is a good RSI number to buy" has no single universal answer. The useful number depends on what the broader trend is doing, which timeframe you trade, and whether other indicators agree.
RSI Settings and How to Adjust Them
The default RSI setting on most platforms, including TradingView, is a 14-period lookback. That works well on daily charts for swing trading.
Matching Settings to Your Style
| Trading Style | Suggested RSI Period | Typical Chart |
|---|---|---|
| Day trading | 7 or 9 | 5-minute, 15-minute |
| Swing trading | 14 (default) | 4-hour, daily |
| Longer-term investing | 21 or 25 | Weekly |
Shorter periods react faster but produce more false signals. Longer periods are smoother but slower to confirm a shift in momentum. There is no universally best setting: it depends on how actively you trade and how much noise you are willing to filter.
How Do You Combine RSI With MACD for Day Trading?
RSI works best when it is not trading alone. Pairing it with MACD (Moving Average Convergence Divergence) adds a second, independent momentum read, and when both agree, the signal carries more weight.
Here is the sequence we use:
- Step 1: Flag the extreme. Watch for RSI to drop below 30 or rise above 70, marking a potential turning point.
- Step 2: Check MACD for a crossover. Look for the MACD line crossing above or below its signal line in the same direction as your RSI signal.
- Step 3: Require timing alignment. Both signals should appear within a few candles of each other, not days apart, especially on intraday timeframes.
- Step 4: Confirm with price structure. A broken short-term trendline or a support/resistance level holding gives the setup a third layer of evidence.
For example, if RSI dips to 28 on a 15-minute chart and the MACD line crosses above its signal line within the next few candles, that combined read is stronger than either indicator alone. This pairing filters out some of the false signals RSI generates by itself, though no combination of indicators removes risk entirely.
When Should You Use RSI, and When Should You Avoid It?
RSI performs best in rangebound markets where price oscillates between clear support and resistance. It is less reliable as a standalone timing tool during strong, sustained trends. The same logic applies across equities, futures, and options markets, where momentum tools are used alongside volatility measures published by venues like Cboe.
Common Mistakes to Avoid
- Selling every overbought signal in an uptrend, which usually means exiting winners far too early.
- Ignoring the broader trend and trading RSI signals in isolation.
- Using default settings on every timeframe without testing what fits your actual style.
- Treating divergence as a guaranteed reversal instead of a warning that needs price confirmation.
Risk Management Basics
RSI should inform your entries and exits, never replace your risk controls. Our team recommends:
- Setting a stop loss below recent support (for longs) or above recent resistance (for shorts), regardless of what RSI reads.
- Risking no more than 1% to 2% of account capital on any single RSI-based setup.
- Treating RSI as one input among several, including price structure, volume, and a second indicator such as MACD.
Watch Out: The more confirmation you require before entering, the fewer false signals you will chase. A single indicator reading is a reason to pay attention, not a reason to click buy.
Frequently Asked Questions
What is RSI and how do you use it?
RSI (Relative Strength Index) is a momentum indicator on a 0 to 100 scale that measures how fast price has moved recently. Traders use it to spot potential overbought (above 70) or oversold (below 30) conditions, then confirm with trend context or another indicator before acting.
What is the best timeframe to use RSI?
There is no single best timeframe. Daily charts with the standard 14-period setting suit swing trading, while shorter periods of 7 to 9 on 5-minute or 15-minute charts suit day trading.
Is an RSI of 40 a good buy or sell?
An RSI of 40 is neutral, neither overbought nor oversold, so it is not a standalone signal. Its meaning depends on the surrounding trend and price structure.
What is a good RSI number to buy?
There is no single good number. Readings near 30 in a ranging market may point to a bounce, while readings near 40 to 50 during an uptrend pullback can also present opportunities.
How do you calculate RSI?
RSI = 100 - (100 / (1 + RS)), where RS is the average gain divided by the average loss over a 14-period lookback. Most platforms calculate it automatically.
Can RSI be wrong?
Yes. RSI can stay overbought or oversold for extended stretches during strong trends, which is why we always combine it with trend analysis and additional confirmation rather than using it in isolation.
Want expert trading insights delivered daily?
Join thousands of traders who rely on Traders Agency for market analysis and trade ideas.
Join Traders AgencyDISCLAIMER: Traders Agency does not offer financial advice. The information provided is for educational purposes only and should not be considered financial advice. Traders Agency is not responsible for any financial losses or consequences resulting from the use of the information provided. Trading carries inherent risks and may not be suitable for all individuals. You are advised to conduct your own research and seek personalized advice before making any investment decisions, recognizing the potential risks and rewards involved.
See more from Traders Agency on Google
Make us a preferred source and our market analysis will appear more prominently in your Google Search, Top Stories, and AI results.
Add to Preferred Sources