
A short squeeze happens when a heavily shorted stock rises sharply, forcing traders who bet against it to buy shares back at increasingly higher prices to close their positions. That buying adds even more upward pressure, creating a feedback loop that can send a stock vertical in a matter of hours. Knowing how to spot a short squeeze before it fully unfolds is one of the more valuable skills in retail trading, and one of the most misunderstood.
We've watched this pattern play out in dozens of names over the years, from small-cap biotech stocks to the GameStop saga that put the phenomenon on the front page. In this guide, we'll walk you through the mechanics behind short squeezes, the specific metrics we check before considering a squeeze play, a real historical example with actual numbers, and the mistakes that cause most traders to lose money chasing these setups.
By the end, you'll know how to spot a short squeeze using data instead of hype, and just as importantly, when to stay on the sidelines.
What Is a Short Squeeze?
Bottom Line: Spotting a short squeeze means checking short interest, days to cover, and cost to borrow together, since high short interest alone is just fuel without a trigger to light it. Traders who chase squeeze setups without confirming both the crowded short position and an actual catalyst tend to lose money entering too late or misreading a crowded trade for an imminent move.
A short squeeze occurs when a stock with a large number of short positions experiences a rapid price increase, forcing short sellers to buy shares to limit their losses. That forced buying pushes the price up further, which triggers more covering, which pushes the price up again.
Here's the mechanic underneath it. When you short a stock, you borrow shares and sell them, hoping to buy them back cheaper later. If the price rises instead of falling, your loss grows with no ceiling. At some point, many short sellers hit a pain threshold and buy back shares to close the trade, a move called covering. When enough traders cover at once, that buying pressure can send the stock climbing even faster.
Think of it like a crowded theater with one exit. If a few people calmly leave, no problem. If everyone tries to leave at the same moment, they create a bottleneck that makes the situation worse for everyone still inside.
Key Concept: A short squeeze is not driven by good news. It's driven by forced buying. Short sellers covering their positions become the demand that pushes price higher, which forces still more covering.
Is a short squeeze good or bad? It depends entirely on which side of the trade you're on. For short sellers, it's a painful and often account-damaging event. For long holders who got in early, it can produce outsized gains in a short window. For everyone who buys near the peak, it's frequently a losing trade.
How Can You Tell If a Short Squeeze Is Coming?
We look for three data points moving together: high short interest (generally above 20% of float), a rising days-to-cover ratio, and an increasing cost to borrow. No single metric confirms a squeeze, but when all three climb at the same time, pressure is building underneath the stock.
We never rely on one number alone. A stock can carry high short interest for months without squeezing if there's nothing forcing shorts to act. What we're actually hunting for is the combination of trapped short sellers and a spark, whether that's a news event, an earnings surprise, or a coordinated buying push from retail traders.
Short Interest as a Percentage of Float
Short interest measures how many shares are currently sold short relative to the total shares available to trade (the float). Exchange-reported short interest is published on a regular schedule, and you can review how the data is compiled through FINRA's short interest resources.
| Input | Value |
|---|---|
| Shares sold short | 10 million |
| Total float | 25 million |
| Short interest as % of float | 40% |
| Our read | Extremely elevated, worth close monitoring |
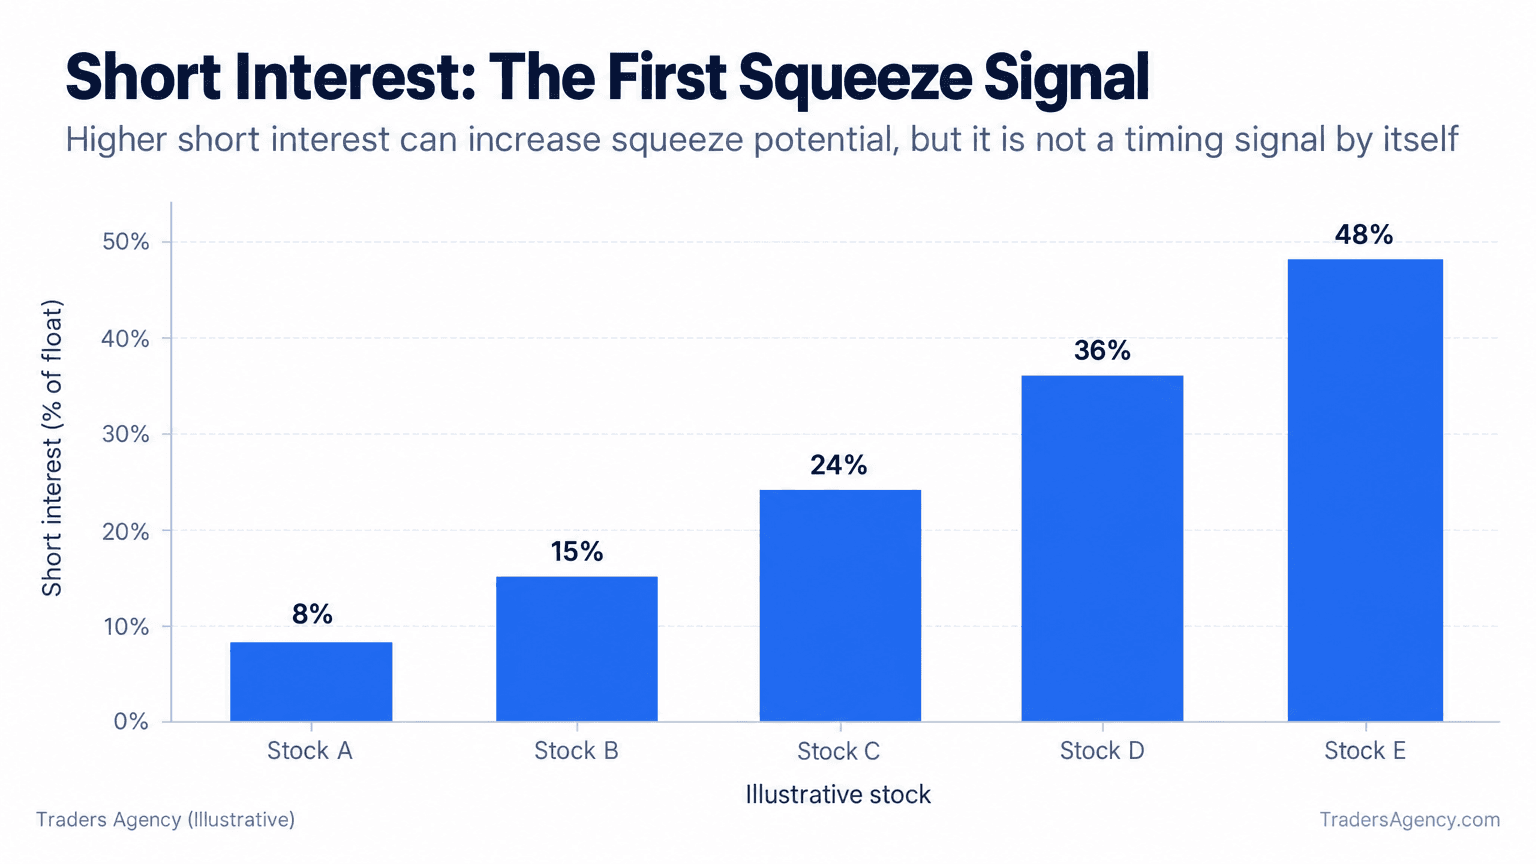
Anything above 20% starts to catch our attention. Above 35% to 40%, the stock sits in territory where a squeeze becomes structurally possible, though never guaranteed.
What Metrics Signal a Short Squeeze?
Short interest tells you how many shorts exist. Days to cover and cost to borrow tell you how trapped those short sellers actually are. Both figures come from data providers that track borrowing activity and average trading volume, and most brokerage platforms surface them for you.
Days to Cover
Days to cover (also called the short interest ratio) divides total shares shorted by average daily trading volume. It estimates how many trading days it would take for every short seller to buy back shares if they all tried to exit at once.
| Input | Value |
|---|---|
| Shares sold short | 5 million |
| Average daily volume | 1 million |
| Days to cover | 5.0 |
| Our read | Elevated. Shorts cannot exit quietly at this level |
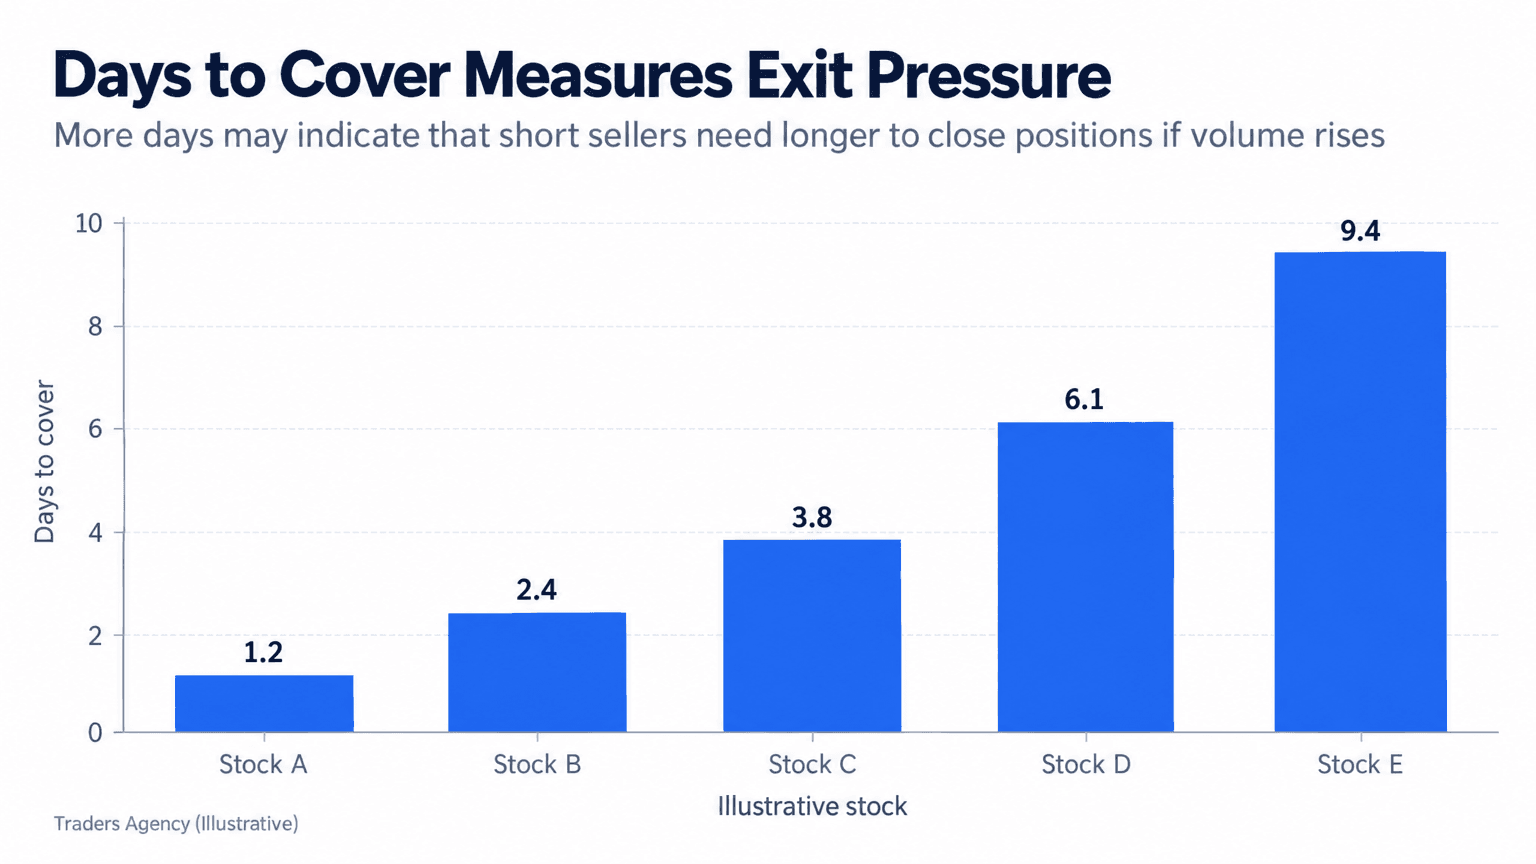
The higher that number, the harder it becomes for shorts to exit without moving price against themselves. We generally treat anything above 5 days to cover as elevated, and above 8 days as a genuine warning sign for anyone holding a short position.
Cost to Borrow
Cost to borrow is the annualized fee a short seller pays to borrow shares, expressed as a percentage. When a stock becomes hard to borrow because so many traders want to short it, that fee can jump from a few percent to well over 50% annualized.
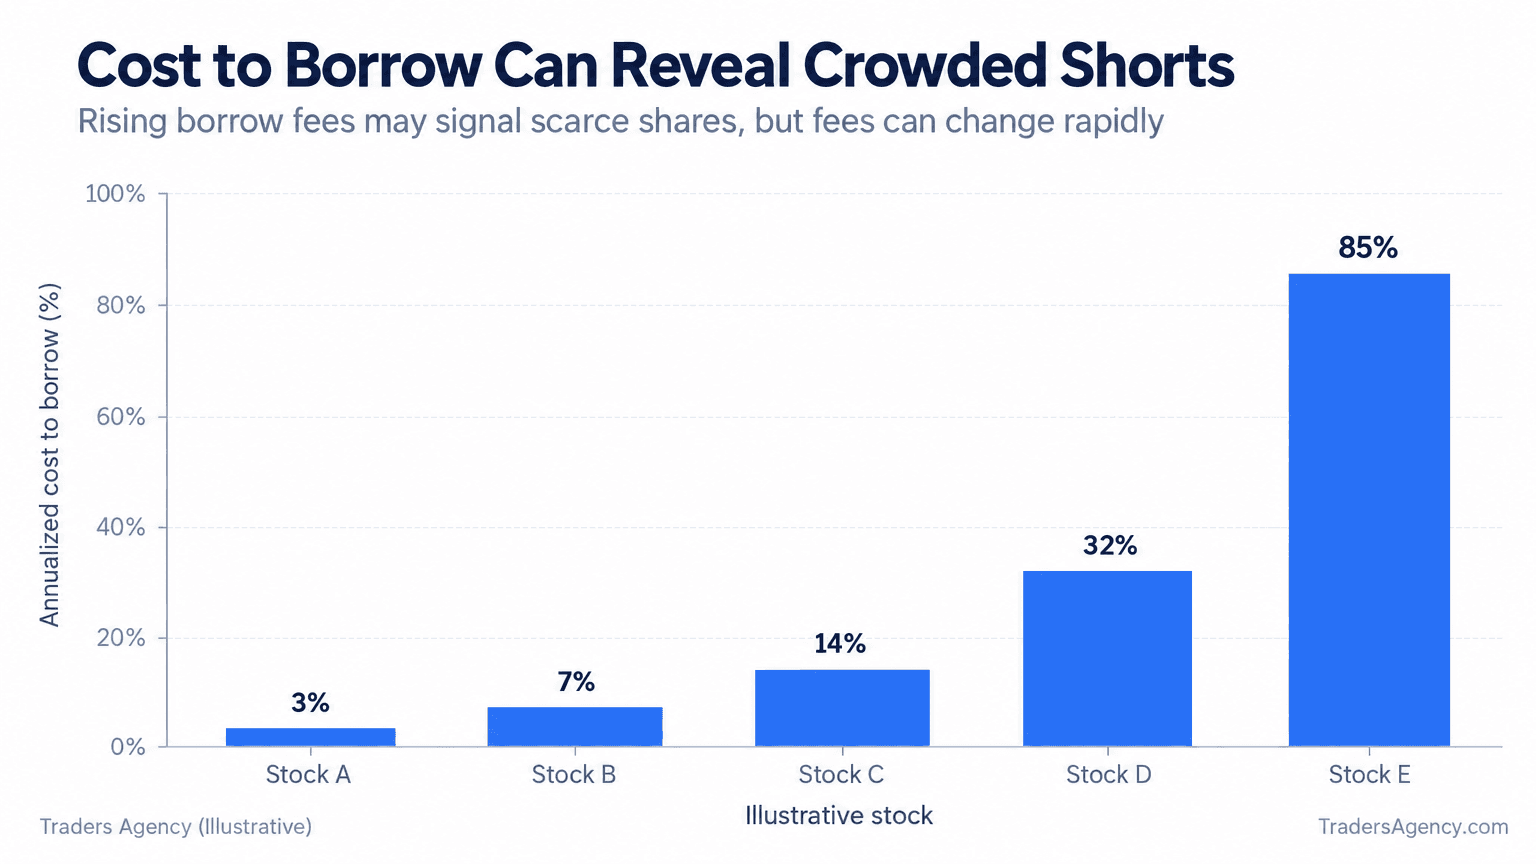
A rising borrow cost paired with limited borrow availability (meaning brokers have few shares left to lend for new short positions) tells us existing shorts are paying more every single day just to stay in the trade. That daily bleed is exactly what forces capitulation.
Our Screening Checklist
Here's the sequence we run through when evaluating a potential squeeze setup:
- Step 1: Check short interest - Look for short interest above 20% to 25% of float.
- Step 2: Measure days to cover - Confirm the ratio is above 5, ideally trending higher.
- Step 3: Track borrow cost - Rising cost to borrow, preferably above 20% to 30% annualized.
- Step 4: Confirm borrow scarcity - Limited or shrinking share availability for new shorts.
- Step 5: Identify the spark - Earnings, news, unusual volume, or heavy retail attention. Without a spark, the setup stays a setup.
Want expert trading insights delivered daily?
Join thousands of traders who rely on Traders Agency for market analysis and trade ideas.
Join Traders AgencyWhat Triggers a Short Squeeze?
A squeeze is typically set off by a piece of news or a sudden volume surge that forces shorts to begin covering, which then feeds on itself. Common triggers include earnings beats, buyout rumors, unexpected partnerships, or a coordinated wave of retail buying on social media.
The trigger doesn't need to be fundamentally significant. It only needs to push price past a level where short sellers start feeling real pain and losses begin tripping margin calls or internal risk limits. Once a handful of larger shorts start covering, the move accelerates, momentum traders pile in, options market makers may need to hedge their exposure (a related dynamic known as a gamma squeeze), and the cycle intensifies. If you want to understand how options hedging amplifies these moves, the educational material at Cboe covers the underlying mechanics well.
Historical Example: The GameStop Squeeze
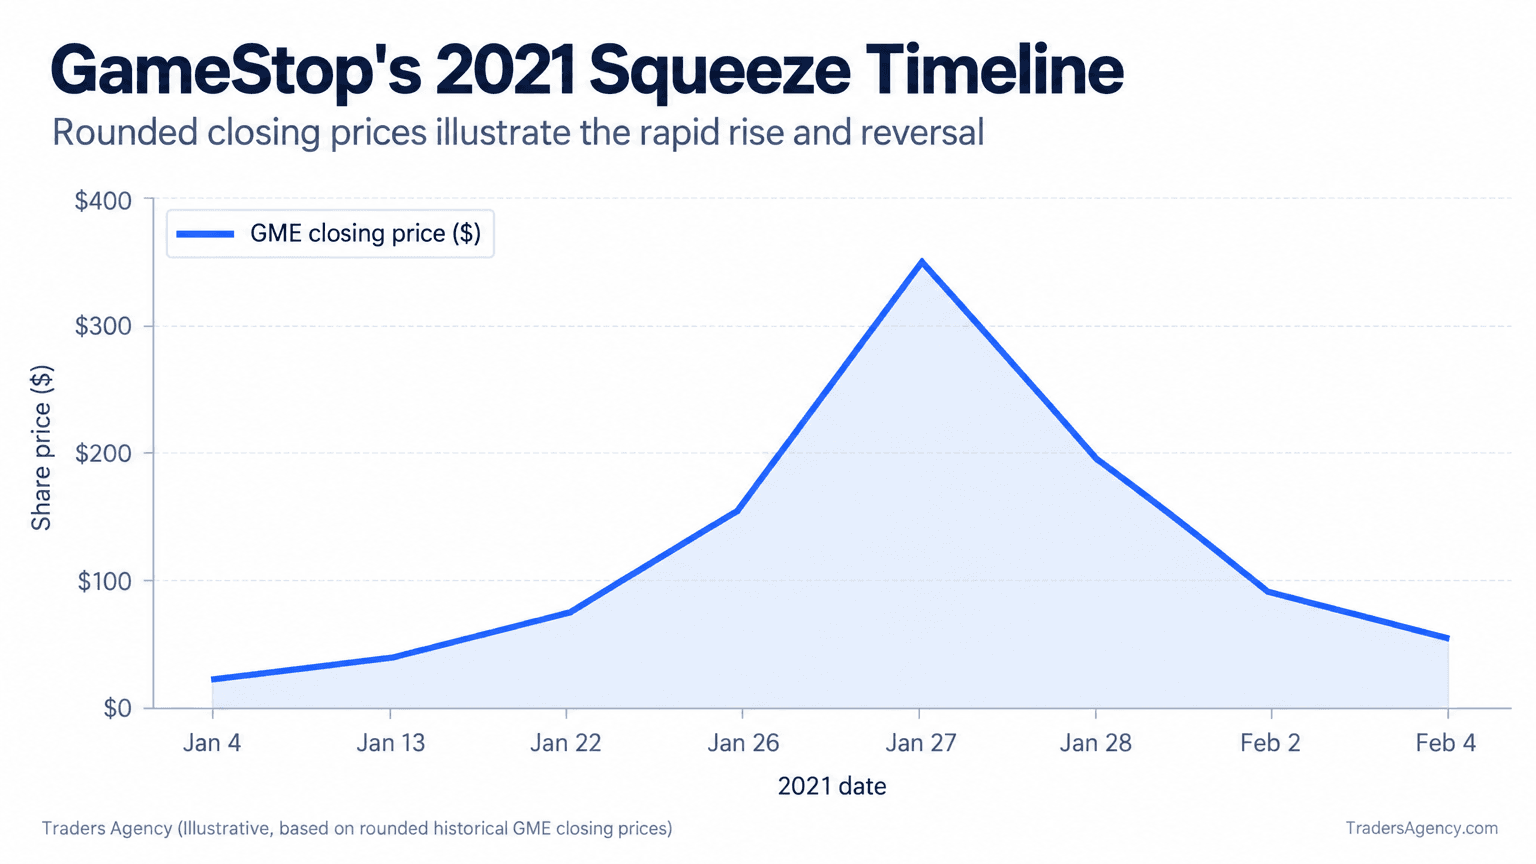
GameStop (GME) remains the clearest short squeeze example in modern retail trading history. In early January 2021, GME traded around $17 a share while short interest was reported above 100% of its float, an extraordinary and rare condition.
| Stage | Approximate Price | What Was Happening |
|---|---|---|
| Early January 2021 | $17 | Short interest above 100% of float, minimal attention |
| Mid-January 2021 | Rising steadily | Volume surge, early covering, retail interest building |
| January 27, 2021 | $348 | Peak forced covering plus heavy options activity |
| Days after peak | Sharp decline | Squeeze exhausted, profit-taking dominated |
By January 27, 2021, GME closed near $348 a share, driven by a coordinated wave of retail buying, heavy options activity, and short sellers scrambling to cover. Within days the stock fell sharply as the squeeze burned itself out. Traders who bought near the top lost money just as quickly as early buyers made it.
That's the pattern we see across nearly every short squeeze: a violent, fast move followed by an equally fast reversal once the forced buying dries up.
When Should You Avoid a Short Squeeze Play?
We steer clear of squeeze plays when the move has already gone parabolic without us, when the short interest data is stale, or when there's no clear reason behind the price action. Chasing a stock after a 100%+ single-day move is one of the most common and costly retail mistakes we see.
Other situations where we stay away entirely:
- Low liquidity setups where spreads are wide and exits are difficult to get filled
- Stocks where the "squeeze thesis" rests purely on social media hype with no supporting short interest data
- Positions sized so large that a normal 20% to 30% pullback would cause serious account damage
- Late-stage moves where days to cover has already collapsed toward 1 or 2, either because shorts have covered or because volume has exploded, leaving little forced buying left in the tank
Watch Out: Most stocks flagged as squeeze candidates never squeeze at all. Lists of the top short squeeze stocks today circulate constantly on social media, and the majority go nowhere, because high short interest by itself is not a trigger.
How Long Does a Short Squeeze Last?
Most short squeezes run anywhere from a few trading sessions to a couple of weeks, with the most intense price action usually compressed into just a handful of days. The sharpest part of the GameStop move happened within roughly three weeks before reversing hard.
Duration comes down to how quickly short sellers exit. If covering happens fast, the squeeze burns out fast. If shorts dig in despite mounting losses, sometimes because they still believe the fundamentals justify the position, the squeeze can stretch out longer with multiple waves of buying and selling.
The opposite of a short squeeze is sometimes called a "long squeeze," where a heavily long-owned stock drops sharply and forces bullish holders to sell into a falling market, accelerating the decline through the same feedback loop in reverse.
Risk Management for Squeeze Plays
Squeeze trading is high volatility, high uncertainty trading. Here's the discipline our team applies to every one of these setups:
- Step 1: Size it small - Keep position size to a small single-digit percentage of total portfolio for speculative squeeze plays.
- Step 2: Define the exit before entry - Use hard stop losses rather than mental ones. These moves reverse in minutes, not days.
- Step 3: Never average down - Adding to a losing position while waiting for a squeeze that never arrives is how accounts get wrecked.
- Step 4: Label the trade honestly - Treat any single squeeze trade as a speculative bet, not a core investment thesis.
Risk Warning: Short squeeze moves can retrace 50% or more within a single session. If you cannot accept a total loss on the position without it affecting your broader account, the position is too large.
Frequently Asked Questions
How can you tell if a short squeeze is coming?
Watch for short interest above 20% to 25% of float, a days-to-cover ratio above 5, and rising cost to borrow, combined with a news event or unusual volume.
What triggers a short squeeze?
Earnings surprises, buyout news, unexpected partnerships, or coordinated retail buying can all set off the initial move that forces short sellers to start covering.
How long does it take for a short squeeze to happen?
The initial spike can occur within a single trading day, while the full cycle from buildup to peak to reversal often plays out over one to three weeks.
What stock is most likely to short squeeze?
Stocks with short interest above 20% of float, high days to cover, elevated borrow costs, and low share availability are the most structurally likely candidates, though a trigger is still required.
Is a short squeeze good or bad?
It depends on your position. Squeezes are typically damaging for short sellers and can be highly profitable for early long holders, but they are punishing for anyone buying near the peak.
How long does a short squeeze last?
Most last from a few days to a few weeks, with the sharpest price moves often compressed into just a handful of trading sessions.
What is the opposite of a short squeeze?
Sometimes called a long squeeze, this happens when a heavily long-owned stock drops sharply, forcing bullish holders to sell and accelerating the decline.
Where can I find short interest and cost to borrow data?
Short interest is reported through FINRA and the major exchanges, while cost to borrow and days-to-cover figures are typically available through brokerage platforms and market data providers.
Remember This: High short interest creates the fuel. A trigger lights the match. Without both, there is no squeeze, only a crowded short trade that can stay crowded for months.
Want expert trading insights delivered daily?
Join thousands of traders who rely on Traders Agency for market analysis and trade ideas.
Join Traders AgencyDISCLAIMER: Traders Agency does not offer financial advice. The information provided is for educational purposes only and should not be considered financial advice. Traders Agency is not responsible for any financial losses or consequences resulting from the use of the information provided. Trading carries inherent risks and may not be suitable for all individuals. You are advised to conduct your own research and seek personalized advice before making any investment decisions, recognizing the potential risks and rewards involved.
See more from Traders Agency on Google
Make us a preferred source and our market analysis will appear more prominently in your Google Search, Top Stories, and AI results.
Add to Preferred Sources