
Support and resistance levels are price zones on a chart where an asset has repeatedly stopped falling or stopped rising. Support is a price floor where buying pressure tends to outweigh selling. Resistance is a price ceiling where selling pressure tends to outweigh buying. These levels form the backbone of most technical analysis, and once you learn to spot them, you'll see them on nearly every chart you open.
By the end of this guide, you'll know how to draw these levels yourself, understand why they form, confirm them with volume, and use them to plan actual trades. We'll walk through a full example with specific price levels so you can see the logic in action, not just the theory.
What Are Support and Resistance Levels?
Bottom Line: Support and resistance levels mark price zones worth watching, not guarantees of what price will do next. Traders use them as decision points, confirming with volume or other tools, then planning entry, stop, and target before price arrives, rather than assuming a level will hold or break.
The support and resistance meaning in trading comes down to supply and demand at specific prices. A support level is a price where buyers have historically stepped in to stop a decline. A resistance level is a price where sellers have historically stepped in to stop a rally.
Picture a stock that dropped to $95 three separate times over two months, and each time it bounced back up. That $95 zone is acting as a support level in trading. Now picture that same stock climbing to $105 four times without ever breaking through. That's resistance.
These aren't exact laser lines. They're zones, usually a dollar or two wide on a stock in this price range, where buying or selling interest clusters. We watch these zones because price tends to react at them again and again, at least until something changes the balance of supply and demand.
Key Concept: Support and resistance are zones, not precise numbers. Treat a level like $95.00 as a band from roughly $94 to $96, and you'll stop getting shaken out by normal price noise.
How Do You Identify Support and Resistance Levels on a Chart?
Finding these levels is mostly pattern recognition. Here's the exact process we teach new traders:
- Step 1: Look for repeated highs and lows. Scan the chart for prices where the candlesticks or price line touched and reversed at least twice. Two touches is the minimum to call it a level. Three or more touches makes it far more reliable.
- Step 2: Draw horizontal lines, not trendlines. Support and resistance start as flat, horizontal lines connecting those touch points. This is different from a rising or falling trendline, which we cover in separate guides.
- Step 3: Widen your zone slightly. Instead of drawing a single hairline at $95.00, treat it as a zone from roughly $94 to $96. Price rarely respects an exact number.
- Step 4: Check multiple timeframes. A level that shows up on both the daily chart and the 4-hour chart carries more weight than one that only appears on a 15-minute chart.
If you want to automate part of this, most charting platforms include a support and resistance indicator that auto-plots recent swing highs and lows. If you're wondering how to find support and resistance levels in TradingView specifically, look for the built-in "Pivot Points Standard" tool, or use the horizontal line drawing tool paired with a swing high/low indicator from the indicators library.
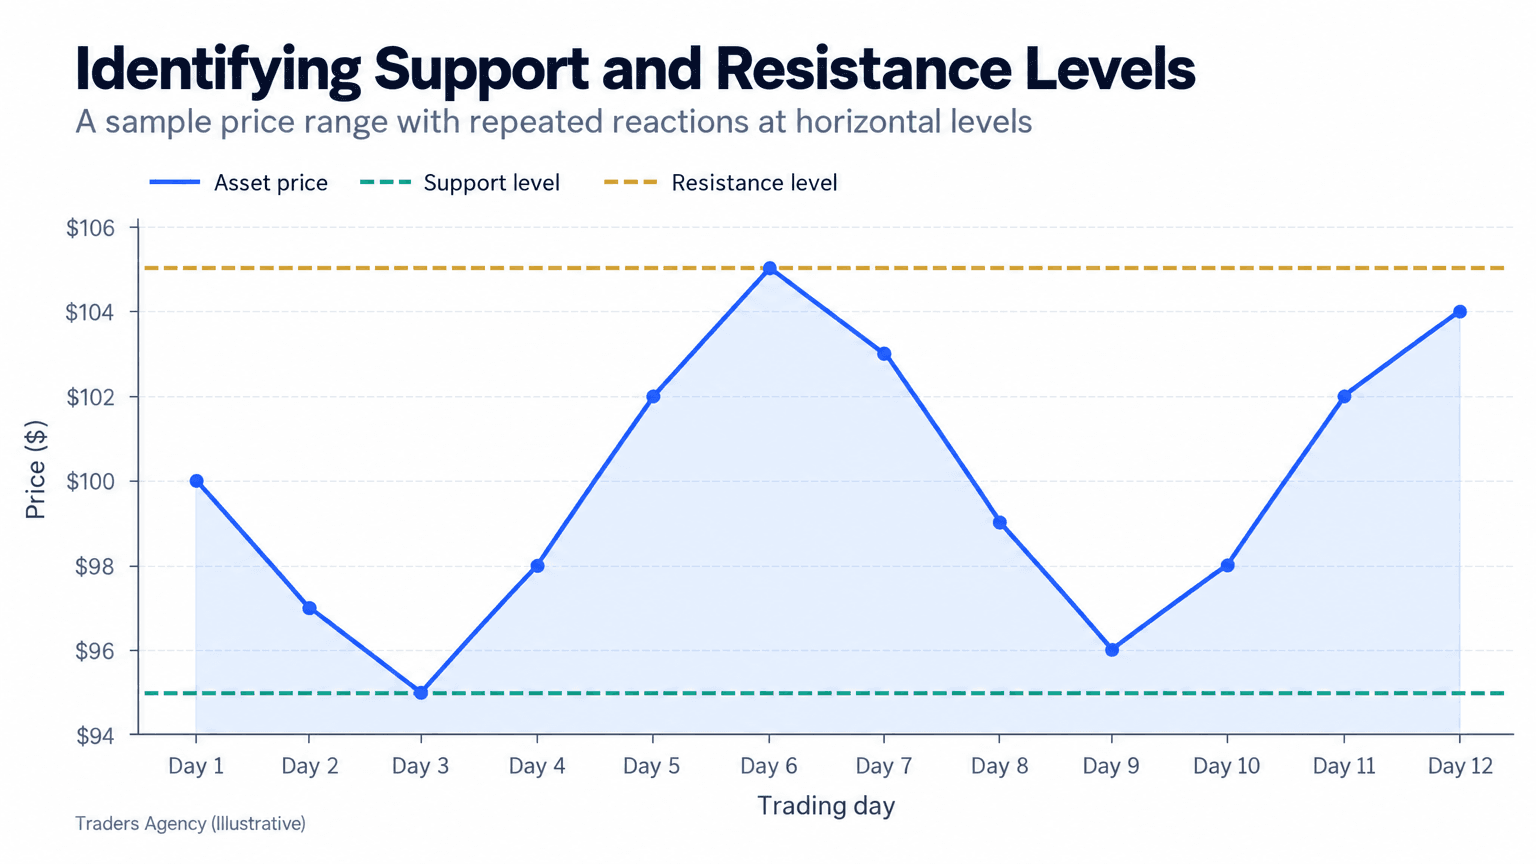
Notice how the price above keeps testing $95 and $105 without breaking either. That repetition is exactly what you're hunting for when you scan a chart.
Why Do Support and Resistance Levels Form?
Support and resistance levels form because traders remember prices where the market previously reversed, and they place orders around those memories. It's a self-reinforcing pattern: enough people buy at a level because it worked before, which pushes price up again and confirms the level.
There's also a mechanical piece to this. Large institutional orders often get filled in stages rather than all at once, which creates clusters of buying or selling at specific prices. Add in stop-loss orders, profit-taking, and algorithmic strategies watching the same obvious levels, and you get genuine supply and demand walls that show up repeatedly on the chart.
There isn't a single support and resistance formula the way there's a formula for a moving average. Classic pivot point calculations (using the prior day's high, low, and close) give you one systematic method, but most levels are drawn from simple visual inspection of past price action.
Round Numbers and Psychological Price Levels
Round numbers act as support and resistance because traders and algorithms both gravitate toward them when placing orders. A stock near $50, $100, or $150 will often see increased buying or selling right at that number, even without any prior price history there.
This is called a psychological level. Think about how you'd set a limit order yourself: it's far more natural to type "100" than "98.73." Multiply that habit across thousands of traders and you get real clustering of orders around whole numbers.
A few practical notes on psychological levels:
- They matter most on higher-priced, widely traded assets where round numbers get discussed publicly (earnings calls, news headlines, options chains).
- Options open interest often piles up at round strike prices, which can reinforce round-number support and resistance in the underlying stock. You can review contract specifications and strike conventions directly at Cboe.
- Combining a round number with a prior swing high or low (say, price previously reversed at $100.20) makes that zone considerably stronger than a round number alone.
Want expert trading insights delivered daily?
Join thousands of traders who rely on Traders Agency for market analysis and trade ideas.
Join Traders AgencyHow Do You Use Volume to Confirm Support and Resistance?
Volume confirms support and resistance by showing whether real trading activity backs up a price reaction, rather than a thin, low-conviction bounce. Higher volume at a support or resistance touch means more traders were actively involved in that reversal, which makes the level more trustworthy.
If price touches $95 and volume spikes noticeably compared to the surrounding days, that tells you real buying interest showed up there, not just a random wiggle. If price touches a level on unusually low volume, treat that touch with more skepticism.
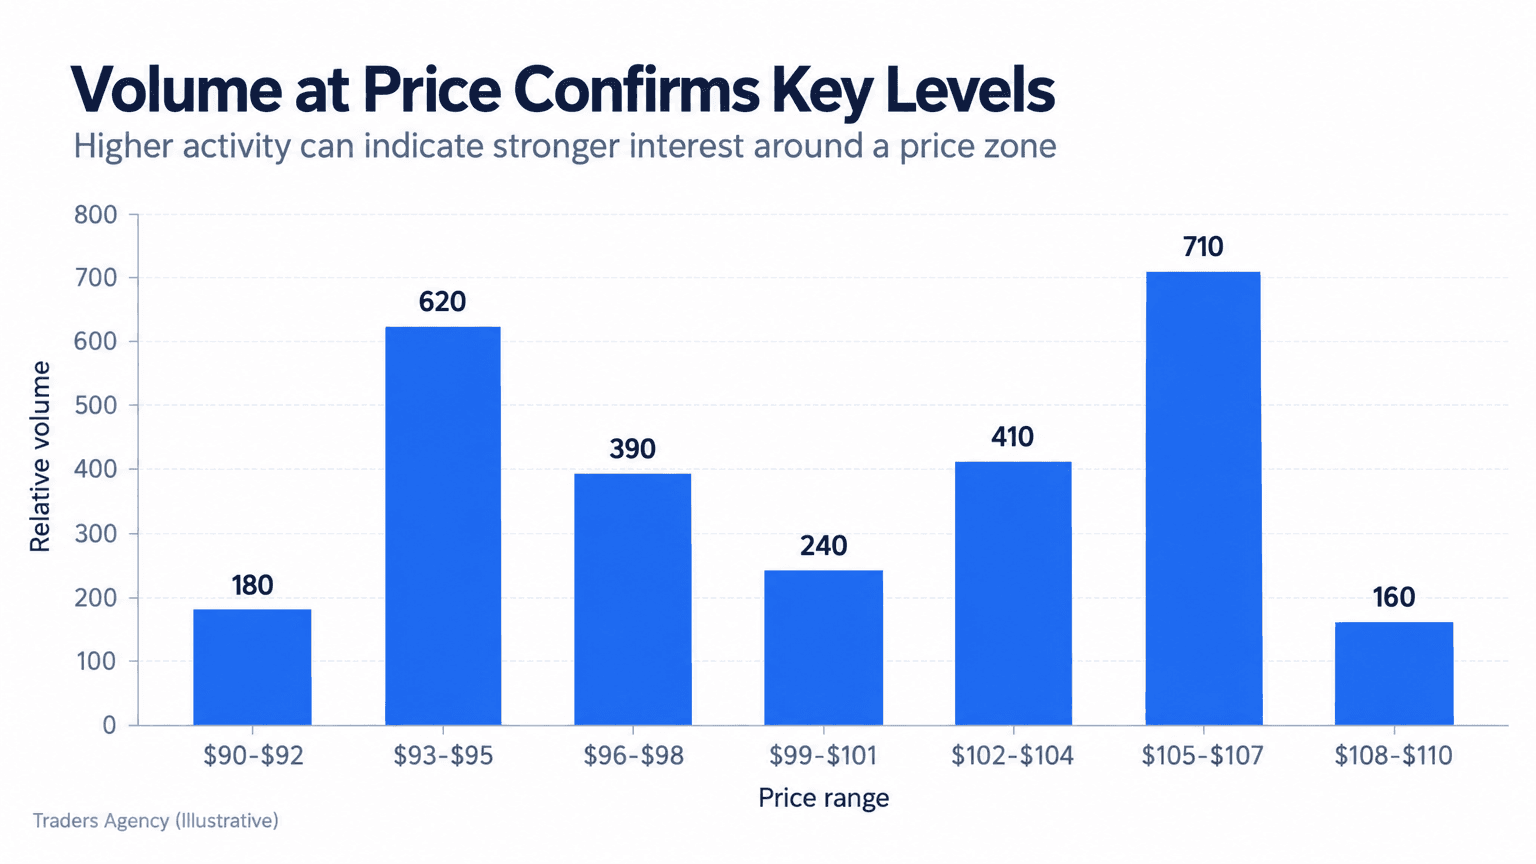
We teach members to check volume any time they're evaluating a support and resistance chart before entering a trade. A level with three touches and rising volume on each touch is a much stronger signal than a level with three touches and shrinking volume.
What Happens When Support and Resistance Levels Break?
When price breaks decisively through a support or resistance level, that level frequently flips roles. Old support becomes new resistance, and old resistance becomes new support. This concept is called role reversal, and it's one of the most useful and most underused ideas in beginner technical analysis.
Step-by-Step: A Role Reversal Example
Let's say a stock has held support at $100 for weeks. One day it breaks below on high volume and drops to $92. Here's how the sequence typically plays out:
- Step 1: The retest begins. Price later rallies back up toward that old $100 level.
- Step 2: Trapped buyers sell. Instead of continuing higher, traders who bought at $100 and are now underwater start selling to break even, capping the rally.
- Step 3: New sellers pile in. Traders who missed the original breakdown see $100 as a logical place to short.
- Step 4: The level confirms. Price gets rejected at $100 and turns back down, confirming the old support is now acting as resistance.
| Stage | Price Level | What the Level Is Doing |
|---|---|---|
| Before the break | $100 | Support (buyers defend the floor) |
| Breakdown on high volume | $100 to $92 | Support fails, sellers take control |
| Retest from below | $100 | Resistance (trapped buyers and new shorts sell) |
| Confirmation | Rejection at $100 | Role reversal complete |
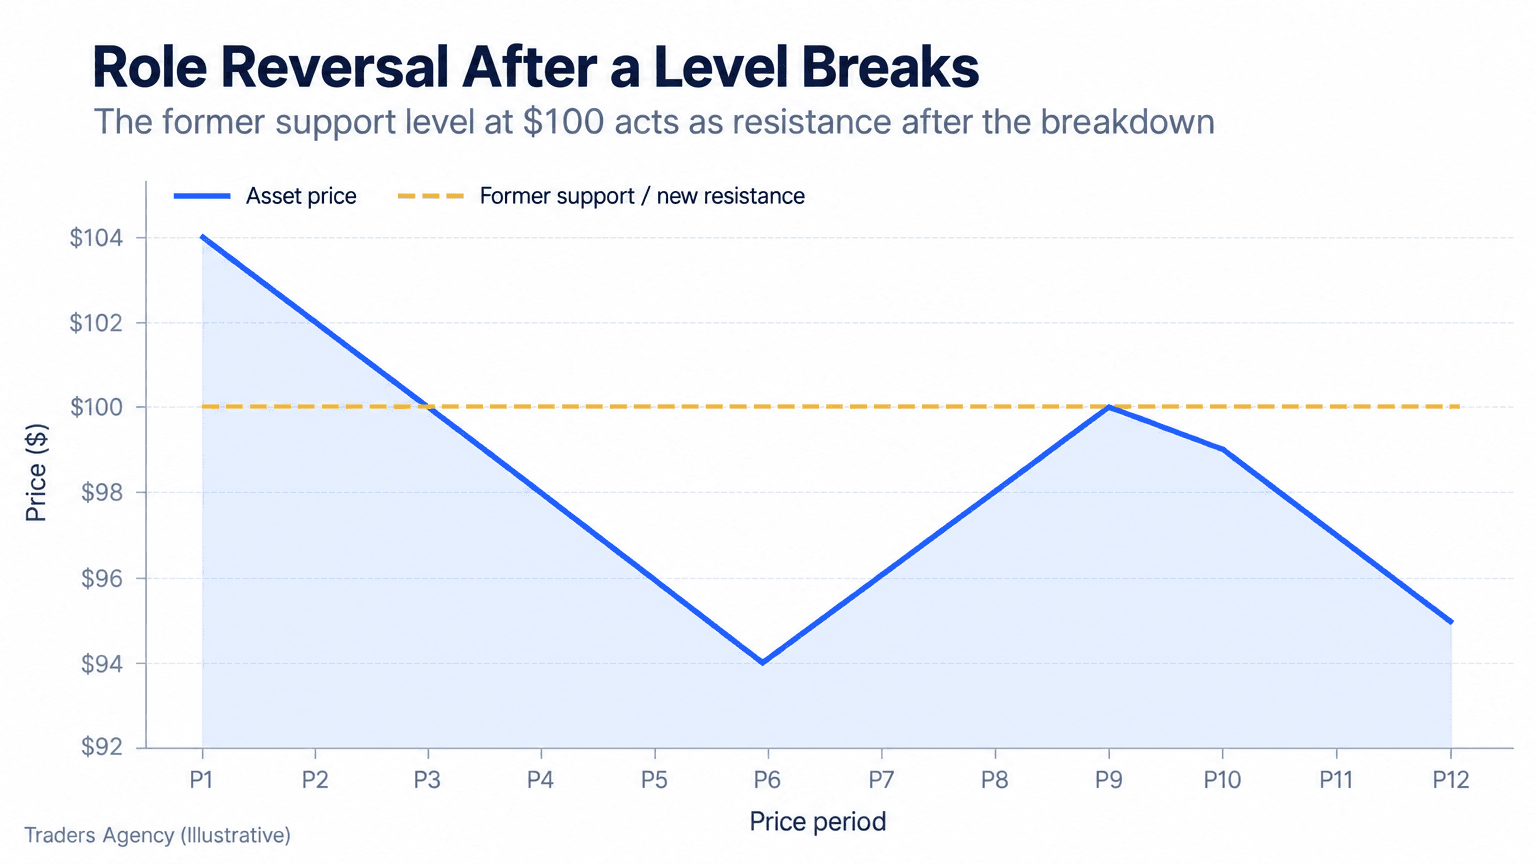
The same logic works in reverse when resistance breaks to the upside: the old ceiling often becomes a new floor on any pullback.
Watch Out: A common mistake is treating every level touch as a breakout the moment price crosses it. We wait for a close beyond the level, ideally with above-average volume, before calling it a genuine break rather than a temporary wick through the zone.
How to Find Correct Support and Resistance Levels
Finding correct support and resistance levels comes down to confirming multiple touches, checking higher timeframes, and validating with volume rather than relying on a single glance at price.
Here are the checks we run before trusting any level:
- Multiple touches: at least two, ideally three or more.
- Multiple timeframes: confirm the level shows up on both a higher and a lower timeframe.
- Volume confirmation: look for above-average volume at the touch points.
- Round number overlap: give the zone extra weight if it aligns with a psychological price.
- Recency: levels formed in the last few months tend to matter more than levels from years ago, especially on daily charts.
What Are the Best Timeframes for Trading Support and Resistance?
Support and resistance levels work on every timeframe, but their reliability scales with the timeframe's length. A support zone on a weekly chart carries more weight than one on a 5-minute chart because it represents a much larger amount of trading activity and trader memory.
For a support and resistance trading strategy, here's how we suggest stacking your timeframes:
| Timeframe | Best Use | Reliability |
|---|---|---|
| Daily / Weekly | Identifying the major, longer-term levels | Highest |
| 4-Hour / 1-Hour | Timing entries once you know the bigger levels | Moderate |
| 5-Minute / 15-Minute | Short-term intraday trading only | Lowest (levels break and reform often) |
Many traders new to this topic look for a support and resistance levels PDF or printable cheat sheet to keep at their desk while practicing on live charts. That's a reasonable way to start, but nothing replaces marking up 20 or 30 real charts yourself until the pattern recognition becomes automatic.
Practical Application: When to Use This and When to Be Careful
Support and resistance analysis works best in markets that are ranging or trending with clear pullbacks, not in choppy, low-volume conditions where levels get broken and reclaimed constantly with no follow-through.
Here are the risk management basics we teach around this concept:
- Place stop-losses just beyond the support or resistance zone, not exactly at the round number itself, since brief wicks through a level are common.
- Never assume a level will hold. Treat every support or resistance touch as a probability, not a certainty.
- Size positions smaller around major economic news or earnings. Events like Federal Reserve rate decisions can blow straight through otherwise reliable levels.
- Combine support and resistance with at least one other tool, such as volume or a moving average, before committing real capital.
Remember This: Support and resistance tell you where to pay attention, not what will happen. The level gives you a decision point with a clearly defined risk. Your job is to plan the entry, the stop, and the target before price ever gets there.
This concept pairs naturally with trendline analysis, moving averages, and chart patterns like triangles or double tops, all of which we cover in separate guides for members building out a fuller technical analysis toolkit.
Want expert trading insights delivered daily?
Join thousands of traders who rely on Traders Agency for market analysis and trade ideas.
Join Traders AgencyDISCLAIMER: Traders Agency does not offer financial advice. The information provided is for educational purposes only and should not be considered financial advice. Traders Agency is not responsible for any financial losses or consequences resulting from the use of the information provided. Trading carries inherent risks and may not be suitable for all individuals. You are advised to conduct your own research and seek personalized advice before making any investment decisions, recognizing the potential risks and rewards involved.
See more from Traders Agency on Google
Make us a preferred source and our market analysis will appear more prominently in your Google Search, Top Stories, and AI results.
Add to Preferred Sources