

Hey, Ross here:
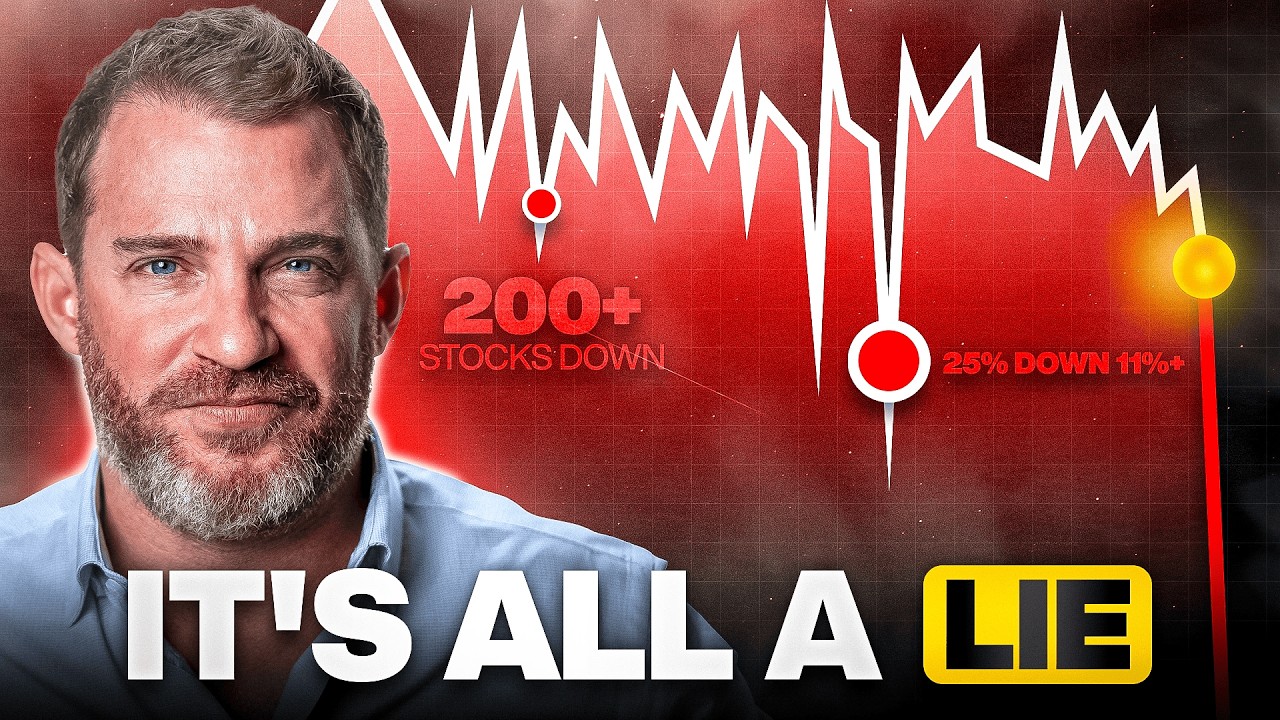
The S&P 500 is up 14% this year and sitting at record highs. More than 4 in 10 stocks inside that index are down. If you own individual stocks and your account doesn't look anything like the headlines, you're not imagining things. That gap is the stock market truth nobody prints next to the record-high headline.
The market isn't one thing. It's 500 things, and right now a handful of them are carrying the other 495 on their backs.
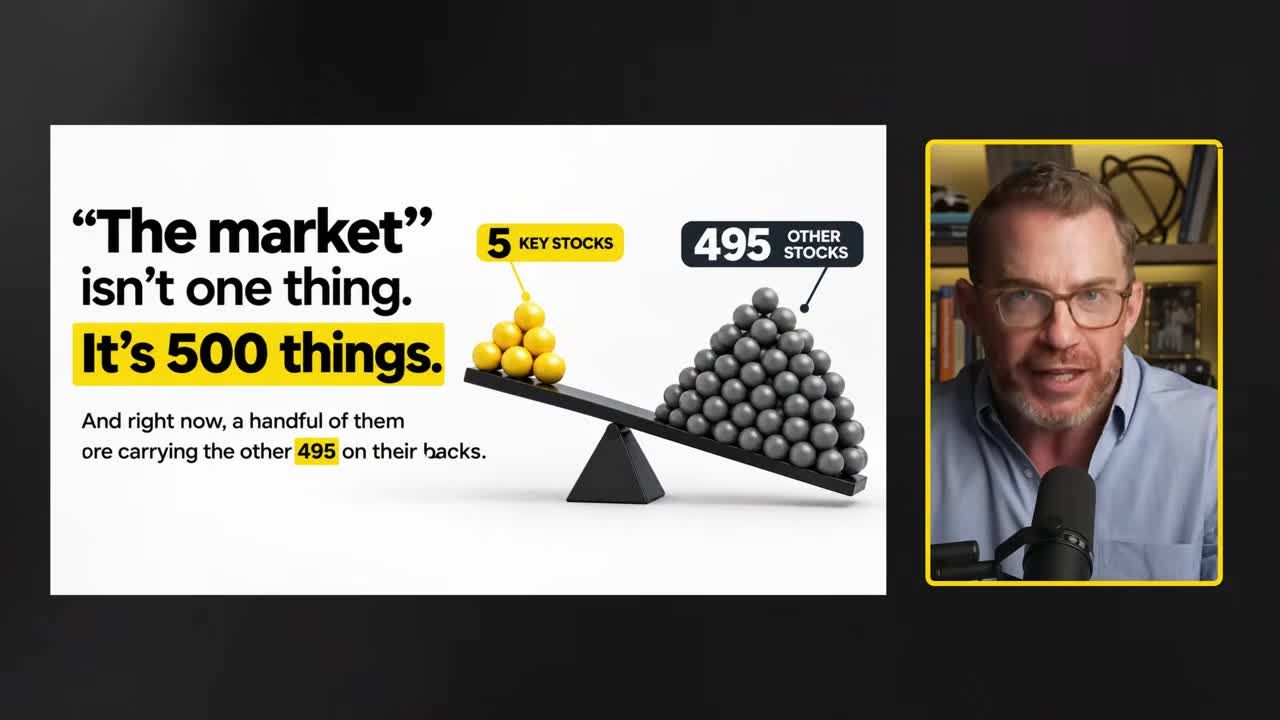
That's not a story Wall Street likes to tell. A record high sells a lot better than a record high with an asterisk next to it. But the data underneath this rally tells a very different story than the index level does.
Below: where the money actually went, the warning signs building beneath the surface, and the specific insurance trade I'd use to protect a portfolio over the next three months.
What is the stock market truth behind record highs versus the average stock?
Bottom Line: The S&P 500's record highs mask a split market: a handful of giant stocks are holding up the index while more than 4 in 10 stocks are actually down and breadth is quietly deteriorating. That gap between the index and the average stock is the real signal to watch, and it's why protective hedges like index puts make sense even during a strong headline year.
Two completely different years, same 500 companies
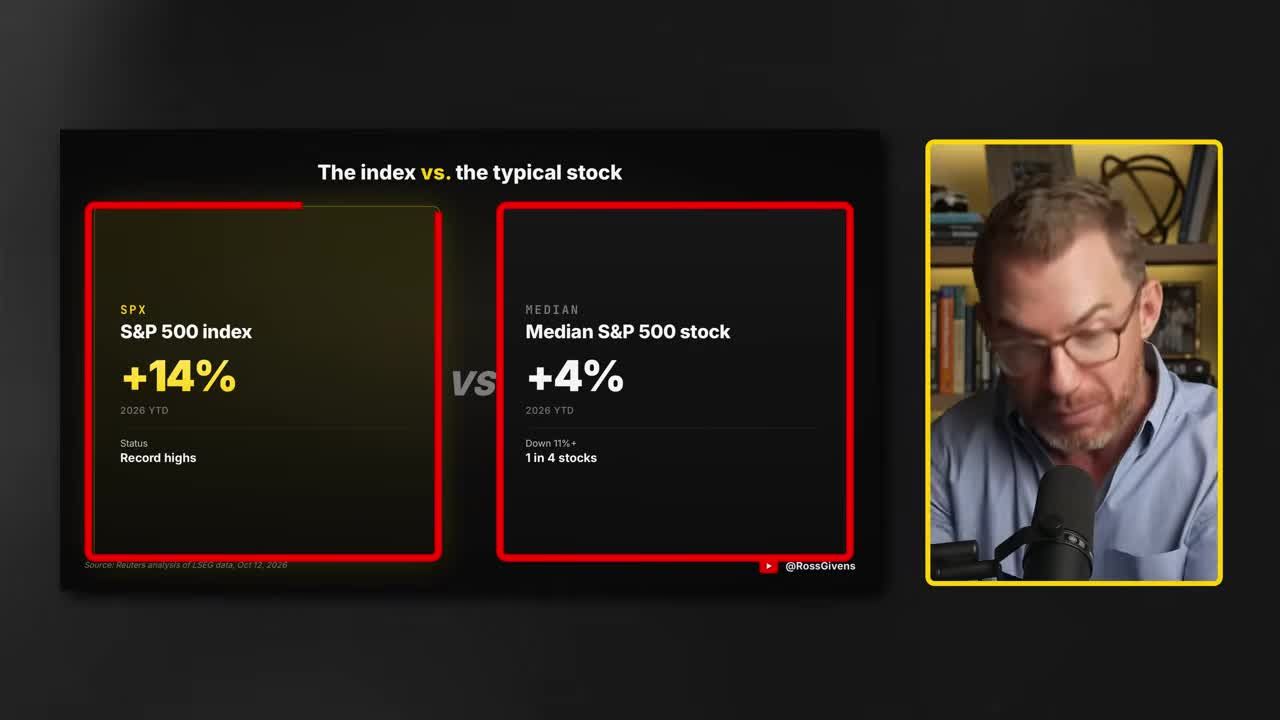
The S&P 500 is up 14%. That's a great year. Most years you take that and move on. But these indexes are weighted by size, so the bigger the company, the more it counts. A giant like NVIDIA moves the index far more than a mid-size bank or a grocery chain, which means the index can rise even when most of the stocks inside it don't.
So what did the typical stock do? Line up all 500 from worst to best and pick the one in the middle. That stock is up 4%. And a quarter of the entire index is down 11% or more.
Four Stocks Did the Lifting
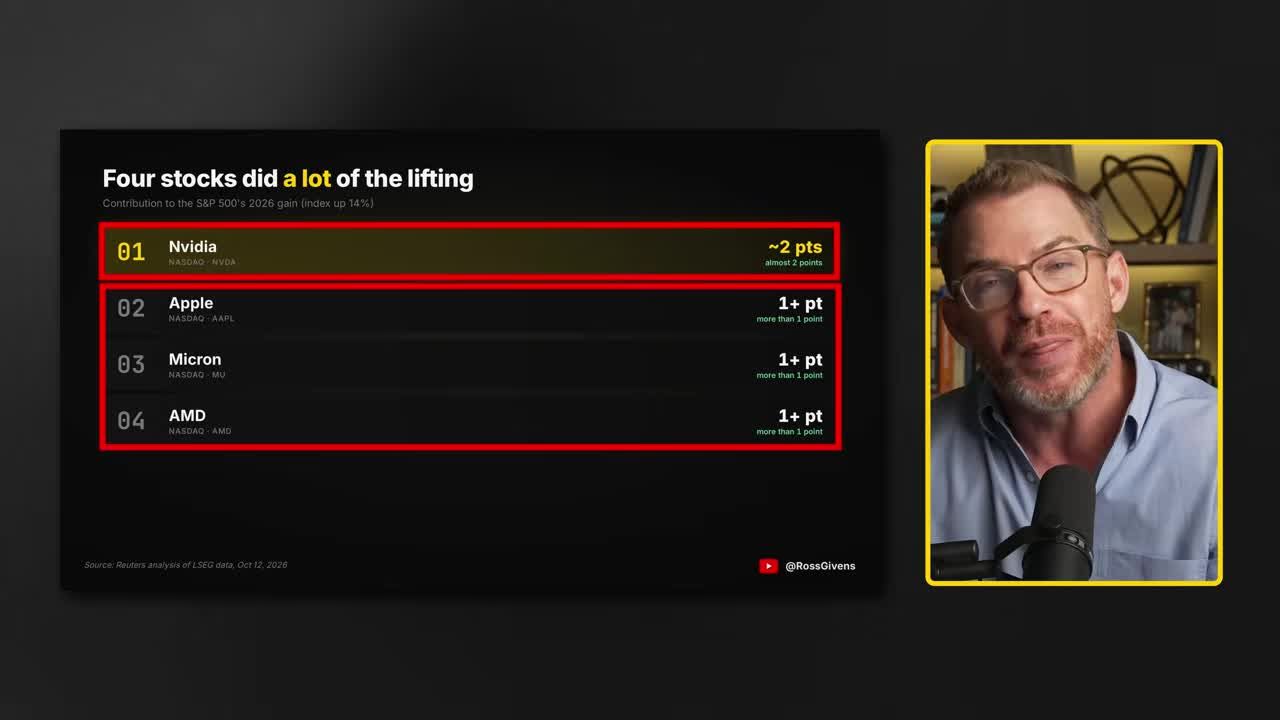
Reuters broke it down. NVIDIA, the most valuable company in the world, added almost two percentage points to the S&P's gain all by itself. Apple, Micron, and AMD each added more than one point. Four companies, more than five points of a 14-point year.
Look at who's on that list. Micron, a memory chip company. For most of its life, Micron was the definition of a boring, cyclical chip stock. Memory is a commodity: too much supply and prices crash, too little and prices soar.
Right now there's way too little. Every AI server suddenly needs huge amounts of memory to feed the chips, and the AI build-out has been sucking up supply faster than factories can make it. When something gets that scarce, the people who make it get to name their price.
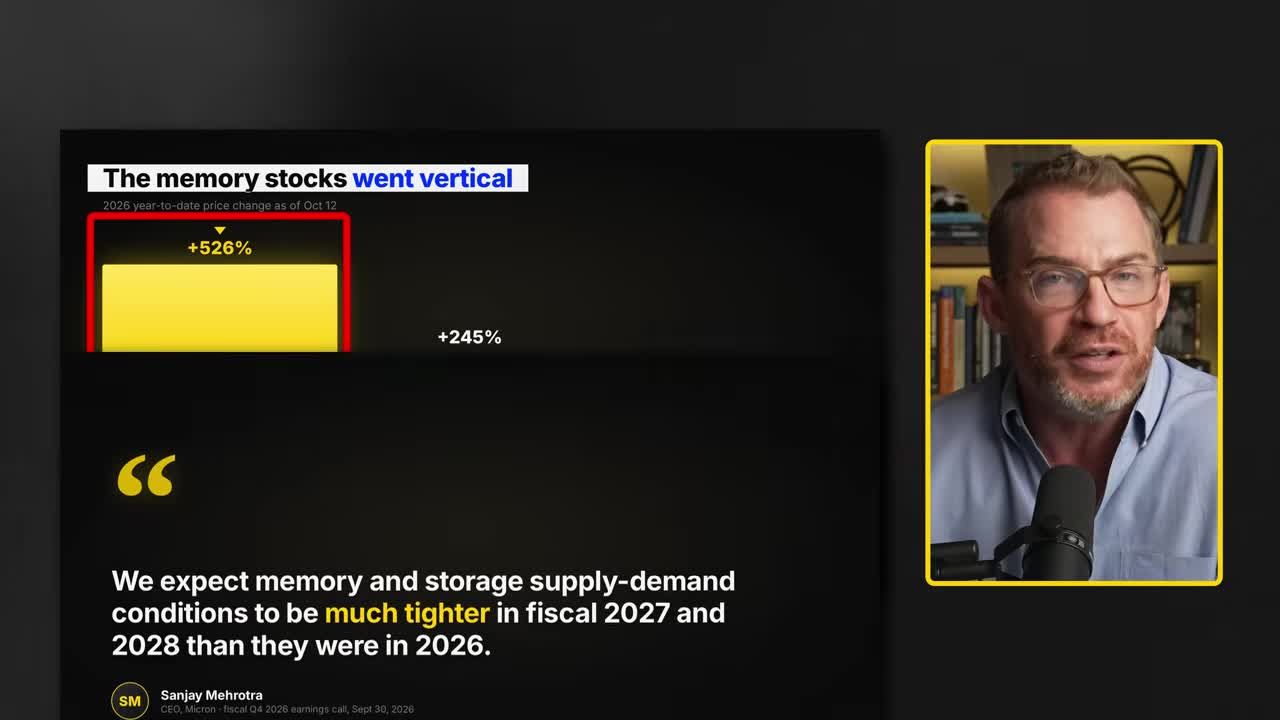
So the memory stocks went vertical. SanDisk and Micron have both more than tripled this year, with SanDisk up more than 500%. And Micron's CEO says it isn't over. Much tighter, not just this year but next year and the year after.
I'm not going to sit here and tell you the AI trade is fake. Those companies are making a ton of money.
But when a market only goes up because of a few stocks, it's like a table standing on two legs. It can stand. It might even look fine from across the room. It doesn't take much of a bump to knock it over, and I'm starting to see bumps.
Are most stocks actually in downtrends right now?
The breadth data under a record high index
Traders and long-term investors both watch the 200-day moving average, the average price of a stock over the last 200 trading days, roughly 10 months. Above that line, a stock is generally considered in a long-term uptrend. Below it, a downtrend.
In a strong market, most stocks sit above that line and the whole market rises together. Right now, fewer than half of the 500 stocks in the S&P are above their 200-day moving average. A week earlier it was only 40%.
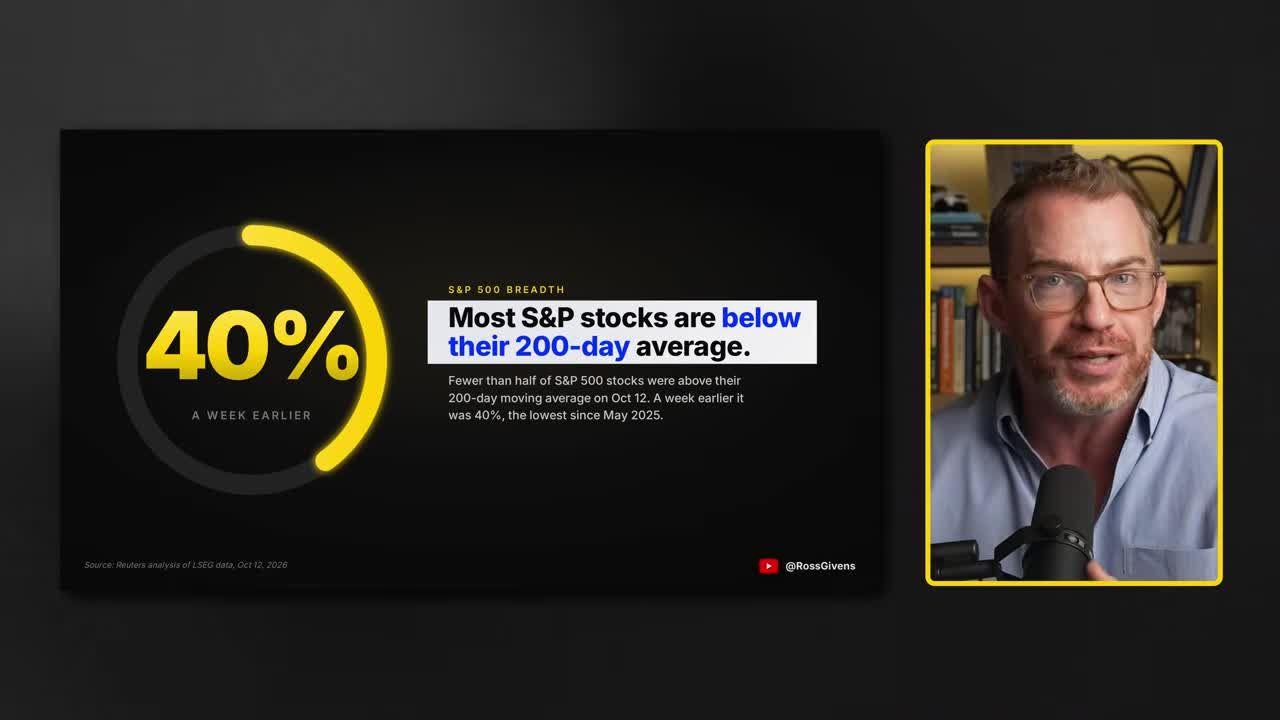
Think about that. The index is at a record high and most of the stocks inside it are in a long-term downtrend. That is the stock market truth sitting underneath a record high, and it is not how healthy markets look. Healthy markets have lots of stocks participating. Weak markets have a few generals marching ahead while the troops quietly go home.
In a decent uptrend, you normally see 60% to 70% of the S&P above its 200-day. You never get 100% participation, but more than half should be there. Since the end of August, that reading has rolled over from 72% in uptrends down to 40%, with only a weak kick back to around 47%.
Two More Signals Saying the Same Thing
- Net new highs versus new lows. This reads every stock across the NASDAQ, New York, and American exchanges each day and nets how many made a new 52-week high against how many made a new 52-week low. Since September 8th, there have consistently been more net new lows than new highs, with the index near record territory.
- The advance-decline line. This tracks whether more stocks rose or fell each day, net. What you want to see is the advance-decline line making new highs before the index does, a sign of real strength beneath the surface. Today it's the opposite: the line is rolling down while the market holds near highs.
The last time this showed up was late 2021. I'm not trying to be the fear guy, but you remember what 2022 was. Back then the index kept marching higher through the second half of the year while the advance-decline line stayed flat. That was the warning that things weren't actually strong, and when it broke to new lows, you could have sidestepped the bulk of the 2022 bear market.
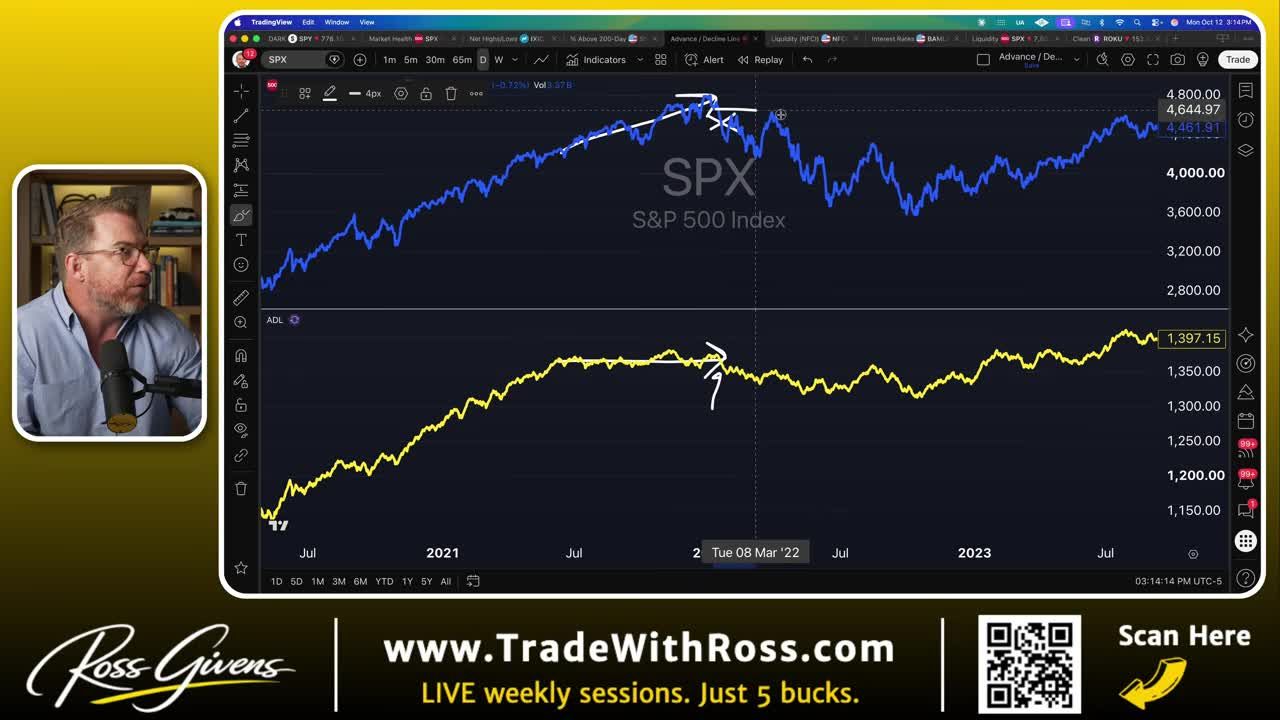
The setup today looks similar. A small handful of stocks driving the index higher while breadth quietly deteriorates. Not the sky falling. Just weakness in the advance-decline ahead of the market.
Money Is Quietly Draining Out
There's a financial conditions angle here too. The Chicago Fed National Financial Conditions Index pulls in hundreds of inputs, everything from LIBOR spreads to loan surveys to margin rates, and tries to tell you whether conditions are loosening or tightening.
When that line falls, conditions are loosening. More borrowing, more debt, more dollars flowing in, and markets tend to rally. When it tightens, less money is coming in, and it tends to move inverse to stocks. One caveat: the readings get revised a couple of weeks later, so it looks better in hindsight than it does in real time. But the tightening right now is clear, and stocks haven't fallen from that pressure yet.
Rates feed directly into this. Higher rates drive up yields on money markets, bonds, and CDs, and people pull money out of stocks to go buy them. Stocks also have to generate a higher earnings yield to stay competitive. As rates climb and investors can get a solid return risk-free, stocks look less and less appealing. You see it in the high-yield effective index, which is business risk plus rates, and it's rising.
None of this means a crash is coming tomorrow. The generals are still running and they're making real money. But a couple of them have started to stumble, and in a market this fragile, there's nobody behind them to pick up the slack. You can't absorb NVIDIA, SanDisk, and Micron falling apart when they're the only thing holding the market up.
Narrow markets can stay narrow for three, six, nine months. I've seen it before. This is also exactly the kind of market where I want insurance.
Get an entire year of live weekly mentoring sessions, my newsletter, indicators, bonus reports, tons more. Click the link and I'll see you in the next live session.
Join my Black Ops Trading ClubWhy don't most investors insure their portfolio against a downturn?
You buy insurance on your house, your car, probably your life. Almost nobody buys insurance on their stock portfolio, which is strange, because for a lot of people that portfolio is worth far more than the car in the driveway.
A put option is how you do it. A put gives you the right to sell something at a set price, the strike price, any time before a certain date. You pay a small fee, the premium, for that right. If the underlying falls to the floor, whoever sold you the put still has to pay your price.
What I'd insure against specifically is the NASDAQ. The problem is that we're leaning on a handful of tech and AI giants, and when those finally roll over, they take the market with them. The easiest vehicle is QQQ, the fund that tracks the NASDAQ 100, the 100 biggest non-financial companies on the exchange. It's loaded with the exact same names carrying this market higher.
Buy It While Nobody Is Scared
The best time to do this is with the market at highs, because at highs nobody is scared and put premiums are cheap. As the market rolls over, volatility climbs and the VIX rises, you'll pay double or triple for the same protection.
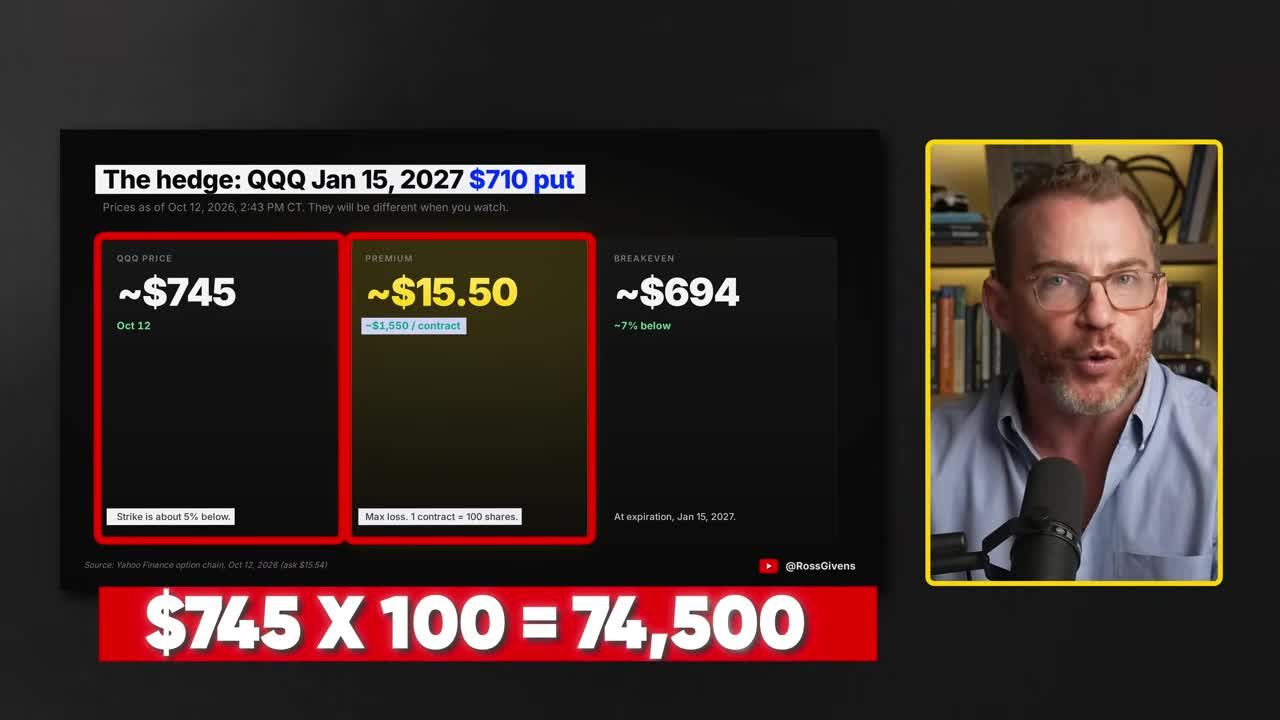
Here's the trade I'd take: the January 15th QQQ $710 put. That's roughly three months of protection. The $710 strike sits about 5% below where the NASDAQ was trading, which acts as a floor on how far you can go down. At $15.50 per share, and since one put contract represents 100 shares, that's about $1,500 per contract covering roughly $75,000 of exposure.
Three Ways This Plays Out
- QQQ flat or up: the put expires worthless and you're out the $1,500. That's your maximum loss. You can never lose more than you paid.
- NASDAQ drops 10%: the put goes from about $15.50 to roughly $38.50 per share, or about $3,870 per contract. Subtract the $1,550 you paid and you're up around $2,320.
- Nothing breaks: you let the insurance expire and keep every share, every dividend, every gain in your underlying positions.
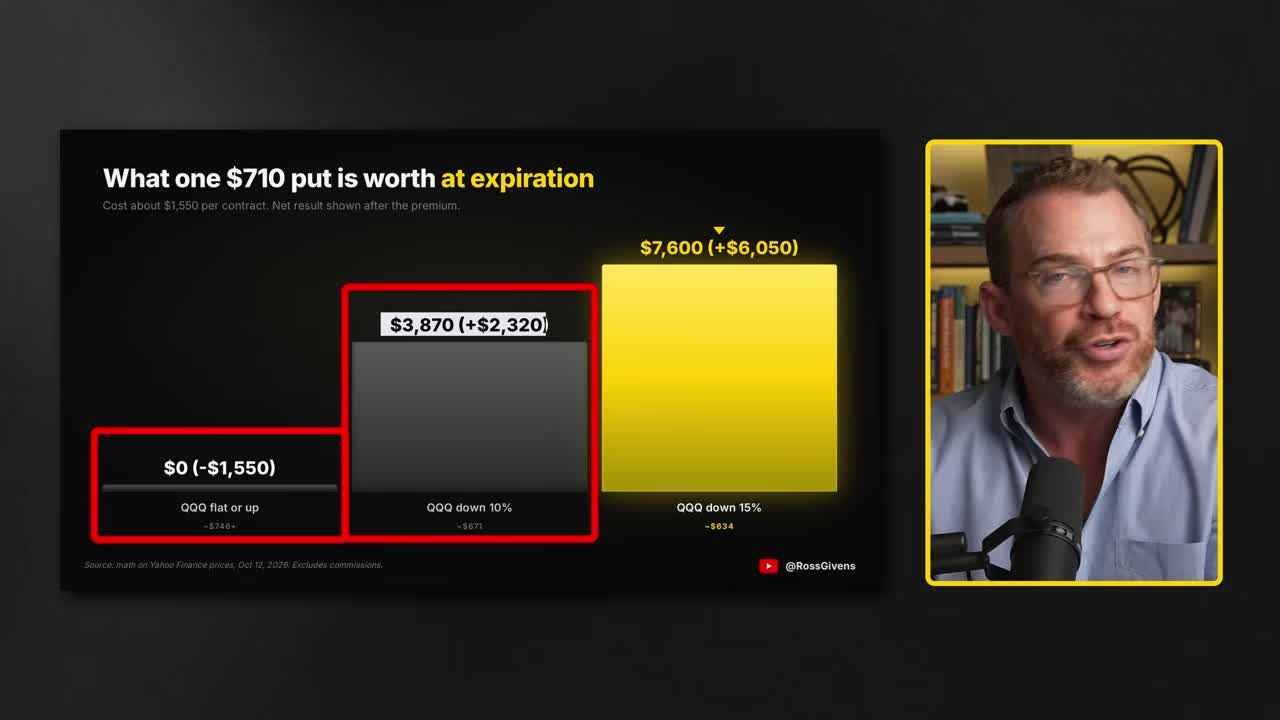
The goal isn't to profit from a crash. We're not hoping stocks go down. If they do, this is designed to make money that offsets the losses in your actual portfolio.
Size It to What You Own
One contract covers about $75,000 of exposure. If you have $20,000 in tech stocks, one contract is more insurance than you need. If you have a million dollars in exposure, you'll want more than one.
And you don't have to sell a single stock to do this. You keep your winners, they can double again from here, you keep your dividends. You just put a floor under the scary part.
Option prices move, so by the time you read this the premium on that January $710 put will be different. If the NASDAQ is higher, the option gets cheaper. If it's lower, it costs a little more. The rule of thumb stays the same: keep the strike about 5% below the current price.
Preparation, Not Fear
The headlines say record high. The typical stock says up 4%. The number of stocks in an uptrend says this market is a lot thinner than it looks. That's the stock market truth in three lines.
I'm not telling you to sell everything or stuff cash under your mattress. The leaders are real and they're making real money. Micron's CEO thinks the shortage runs through 2028.
But markets don't fall apart when everyone is scared. They fall apart when the index looks perfect and the foundation is quietly cracking. That's what this is starting to look like to me: a few giants holding up the whole roof.
So I want to know what happens if one of them sneezes or trips. A put on the QQQ answers that question. Pay 2%, get the protection, sleep at night, especially if you're up big on the year. That decision is ultimately yours.
Get an entire year of live weekly mentoring sessions, my newsletter, indicators, bonus reports, tons more. Click the link and I'll see you in the next live session.
DISCLAIMER: Traders Agency does not offer financial advice. The information provided is for educational purposes only and should not be considered financial advice. Traders Agency is not responsible for any financial losses or consequences resulting from the use of the information provided. Trading carries inherent risks and may not be suitable for all individuals. You are advised to conduct your own research and seek personalized advice before making any investment decisions, recognizing the potential risks and rewards involved.
See more from Traders Agency on Google
Make us a preferred source and our market analysis will appear more prominently in your Google Search, Top Stories, and AI results.
Add to Preferred Sources