
If you've ever seen a headline like "Bitcoin flashes death cross" or "S&P 500 confirms golden cross," you've already met two of the most talked-about signals in technical analysis. They sound dramatic, but once you understand how they're built, they're actually simple, mechanical, and easy to spot on your own charts. In this guide, we'll show you exactly what a golden cross and death cross are, how to identify them, where they tend to fail, and how our team combines them with other tools for higher-conviction trades.
What Is a Golden Cross vs Death Cross?
Bottom Line: Golden crosses and death crosses are lagging signals built from the 50-day and 200-day moving averages, so they confirm a trend shift rather than predict one. Treat them as one piece of confirmation alongside price action and risk management, not as a standalone entry or exit trigger.
The golden cross and death cross both come down to two moving averages, usually the 50-day and 200-day simple moving averages (SMA), crossing paths on a price chart. When the 50-day SMA crosses above the 200-day SMA, that's a golden cross. When it crosses below, that's a death cross.
A moving average smooths out daily price noise by calculating the average closing price over a set number of periods. The 50-day SMA reflects shorter-term price behavior, while the 200-day SMA reflects the longer-term trend. When the short-term average overtakes the long-term average, it suggests recent price action has turned strong enough to pull the whole trend upward. That's the logic behind a golden cross.
A death cross works the same way in reverse. When the 50-day average slips below the 200-day average, it suggests recent price weakness has dragged the shorter-term trend below the longer-term baseline. We watch death cross setups closely because the signal often appears after a market has already dropped meaningfully, which is both its strength and its weakness as a timing tool.
Here's the simplest way to think about it: these are trend confirmation signals, not predictions. They tell you what has already started happening to the trend, not what's about to happen next.
Key Concept: A golden cross and death cross are lagging signals built from the 50-day and 200-day SMA. They confirm a trend that is already underway, they don't forecast one before it starts.
Key Terms to Know
- Simple Moving Average (SMA): the average closing price over a fixed number of past periods, updated daily.
- Exponential Moving Average (EMA): a moving average that weights recent prices more heavily, making it react faster.
- Crossover: the moment one moving average line crosses above or below another on the chart.
- Lag: the delay between when a price trend actually changes and when the moving average reflects that change.
How Do You Identify a Golden Cross or Death Cross on a Chart?
You don't need special software to spot these signals. Most charting platforms, including free ones, let you add both a 50-period SMA and a 200-period SMA to any chart in a couple of clicks.
Step-by-Step Setup
- Step 1: Open a daily chart of the stock, index, or asset you're watching. Daily charts are the standard timeframe for this strategy.
- Step 2: Add a 50-day SMA as one overlay, usually shown as a thinner or differently colored line.
- Step 3: Add a 200-day SMA as a second overlay.
- Step 4: Watch for the crossing point. When the 50-day line crosses from below to above the 200-day line, that's your golden cross. When it crosses from above to below, that's your death cross.
- Step 5: Mark the date and price where the cross occurs. This becomes your reference point for tracking what happens next.
A clean golden cross will show the 50-day SMA clearly separating upward from the 200-day SMA, often alongside rising volume. A death cross shows the opposite: the 50-day line sliding beneath the 200-day line, often after a sustained decline.
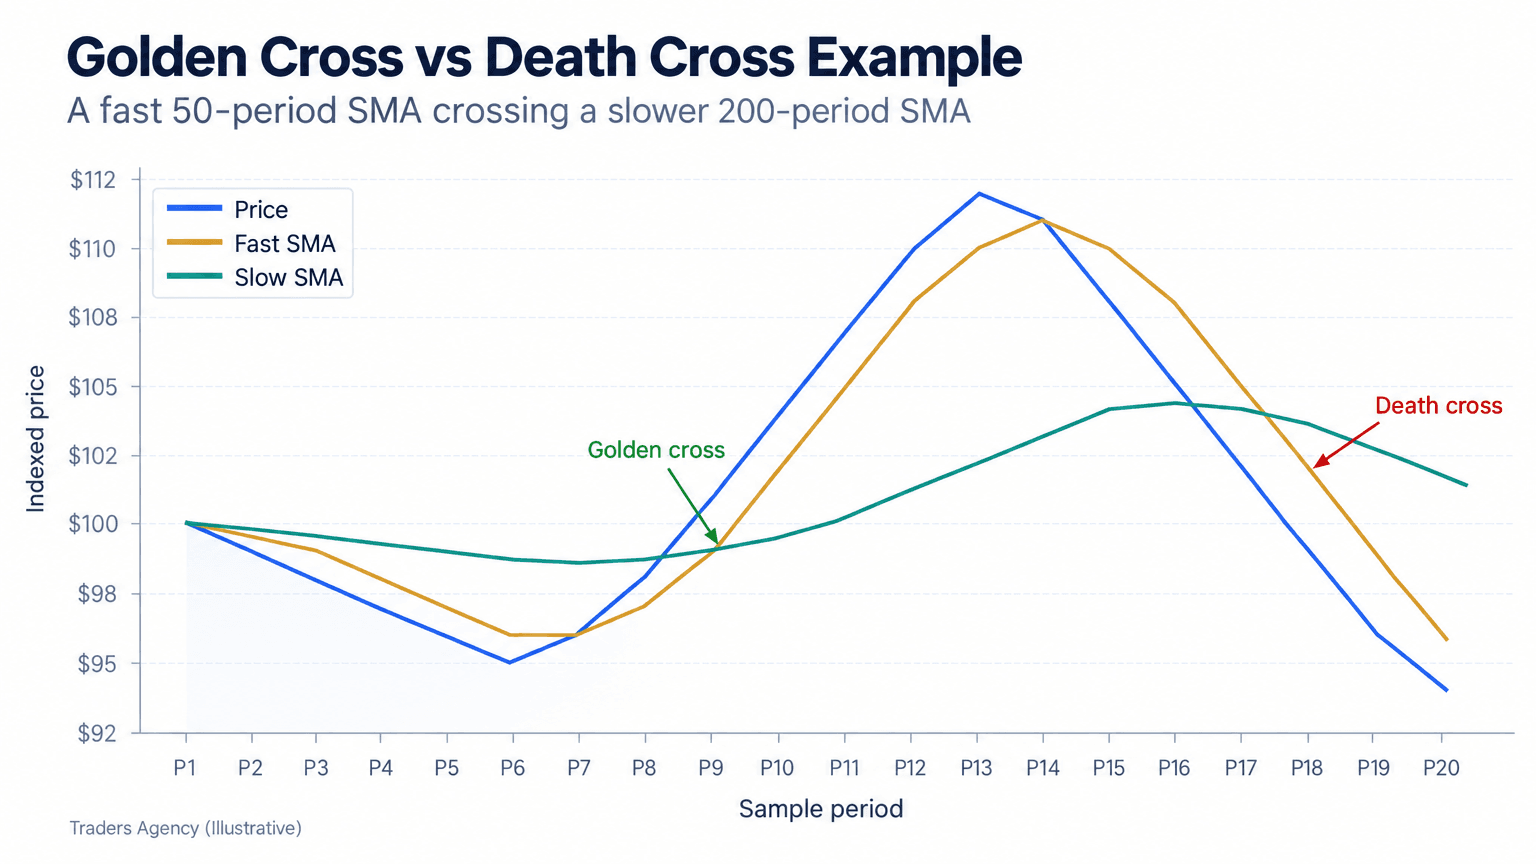
A Golden Cross and Death Cross Example
Say a stock trades sideways for months, then rallies steadily. If the 50-day SMA climbs from $42 to $48 while the 200-day SMA sits flat near $45, the two lines will eventually meet and cross. The moment the 50-day line passes above $45 and keeps climbing, you have a golden cross confirmed at roughly that price level.
Now flip the scenario. A stock has been declining for weeks. If the 50-day SMA falls from $60 to $50 while the 200-day SMA holds near $55, the crossing point where the 50-day line drops below $55 marks the death cross.
| Scenario | 50-Day SMA Movement | 200-Day SMA Level | Signal |
|---|---|---|---|
| Uptrend forming | Rises from $42 to $48 | Flat near $45 | Golden Cross |
| Downtrend forming | Falls from $60 to $50 | Flat near $55 | Death Cross |
Want expert trading insights delivered daily?
Join thousands of traders who rely on Traders Agency for market analysis and trade ideas.
Join Traders AgencyWhy Do Crossover Signals Lag, and Can They Be False?
Moving average crossovers always lag price because they're built from past data. The 200-day SMA, by definition, needs 200 days of price history to calculate, so by the time a golden cross or death cross appears, the underlying trend shift may have already been running for weeks.
This lag is the single biggest limitation of trading off these signals. A golden cross often confirms a new uptrend only after a stock has already moved well off its lows, meaning a meaningful chunk of the early gains has passed before the signal even triggers. Death crosses have the same issue in reverse: a stock might already be down significantly before the death cross officially confirms the downtrend.
False signals happen most often in choppy or sideways markets, where price oscillates enough to trigger a crossover without any real trend forming. A stock could flash a golden cross, drift sideways for two weeks, then drop back below the 200-day SMA, effectively canceling the signal. This is sometimes called a whipsaw, and it's a real risk anyone trading these signals needs to plan for.
We treat crossovers as confirmation tools, not early warning systems. We don't chase a golden cross the day it prints. We wait to see if price holds above the crossover level for a few sessions before treating it as a real trend.
Watch Out: A golden cross or death cross can get reversed within days in a choppy market. Never treat the crossover alone as a trade trigger, wait for the price to hold the new level before acting.
Golden Cross vs Death Cross: Key Differences
| Feature | Golden Cross | Death Cross |
|---|---|---|
| Direction of crossover | 50-day SMA crosses above 200-day SMA | 50-day SMA crosses below 200-day SMA |
| Market interpretation | Bullish, potential new uptrend | Bearish, potential new downtrend |
| Common context | Often follows a bottoming pattern | Often follows a topping pattern |
| Typical trader reaction | Watch for continuation, consider long entries | Watch for continuation, consider reducing exposure or hedging |
| Reliability | Stronger in trending bull markets | Stronger in confirmed bear markets |
The success rate of these signals tends to improve in markets that already have broader bullish momentum behind them, like a recovering economy or sector-wide rally. In purely sideways markets, both signals are far less reliable, which is why context always matters more than the crossover alone.
Quick Reference: Golden Cross vs Death Cross at a Glance
- Golden cross = short-term average rises above long-term average = bullish signal.
- Death cross = short-term average falls below long-term average = bearish signal.
- Both signals are lagging indicators, confirming trends rather than predicting them.
- Reliability depends heavily on surrounding market conditions and volume.
- Neither signal guarantees future price direction on its own.
What Is the Best Timeframe for Moving Average Crossover Strategies?
The classic 50/200 SMA setup is built for daily charts and longer-term swing or position trading. It's not designed for day trading, since the 200-day average barely moves day to day.
Shorter-term traders sometimes adapt the concept using smaller periods, like a 10-day and 50-day crossover on daily charts, or even 9-period and 21-period EMAs on hourly charts. These faster setups generate more signals, which means more opportunities but also more false signals.
EMA Crossover Alternatives
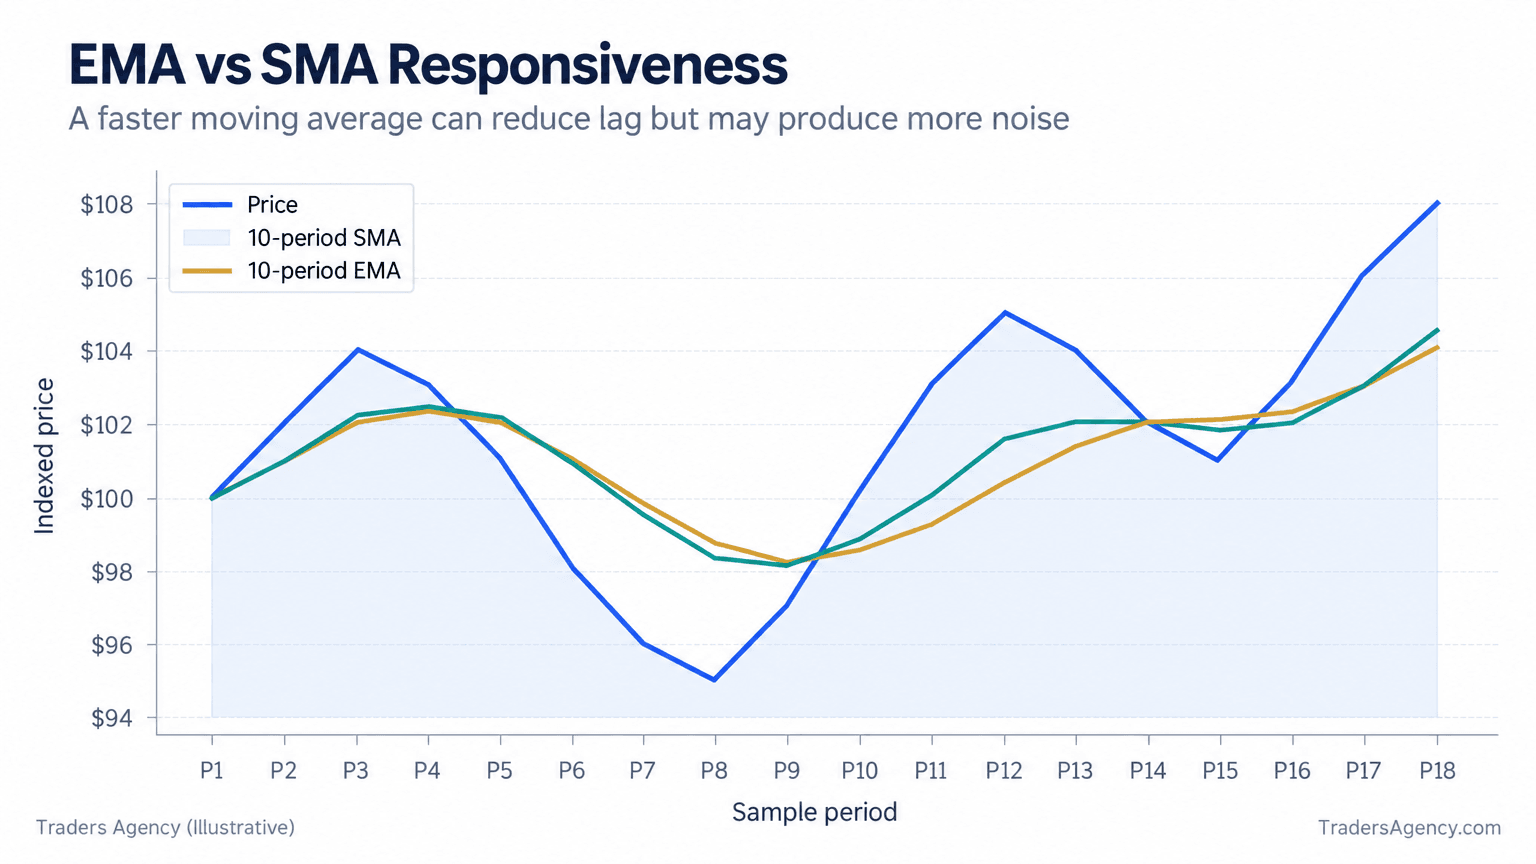
An exponential moving average (EMA) reacts faster to recent price changes than an SMA because it weights newer data more heavily. Traders who want earlier signals, with the tradeoff of slightly more noise, often swap in EMAs instead of SMAs.
A 50-day EMA and 200-day EMA crossover will typically trigger a few days earlier than the SMA version during a genuine trend change. That earlier entry can mean a better price, but it also means EMA crossovers are somewhat more prone to whipsaws in choppy conditions.
Backtesting Across Market Conditions
Historical behavior of crossover signals varies a lot depending on the surrounding market regime. In strong bull markets, golden crosses tend to show stronger follow-through because the broader trend is already supportive. In bear markets, death crosses tend to show stronger follow-through for the same reason, in reverse. In sideways markets, both signals show weaker follow-through and more false triggers.
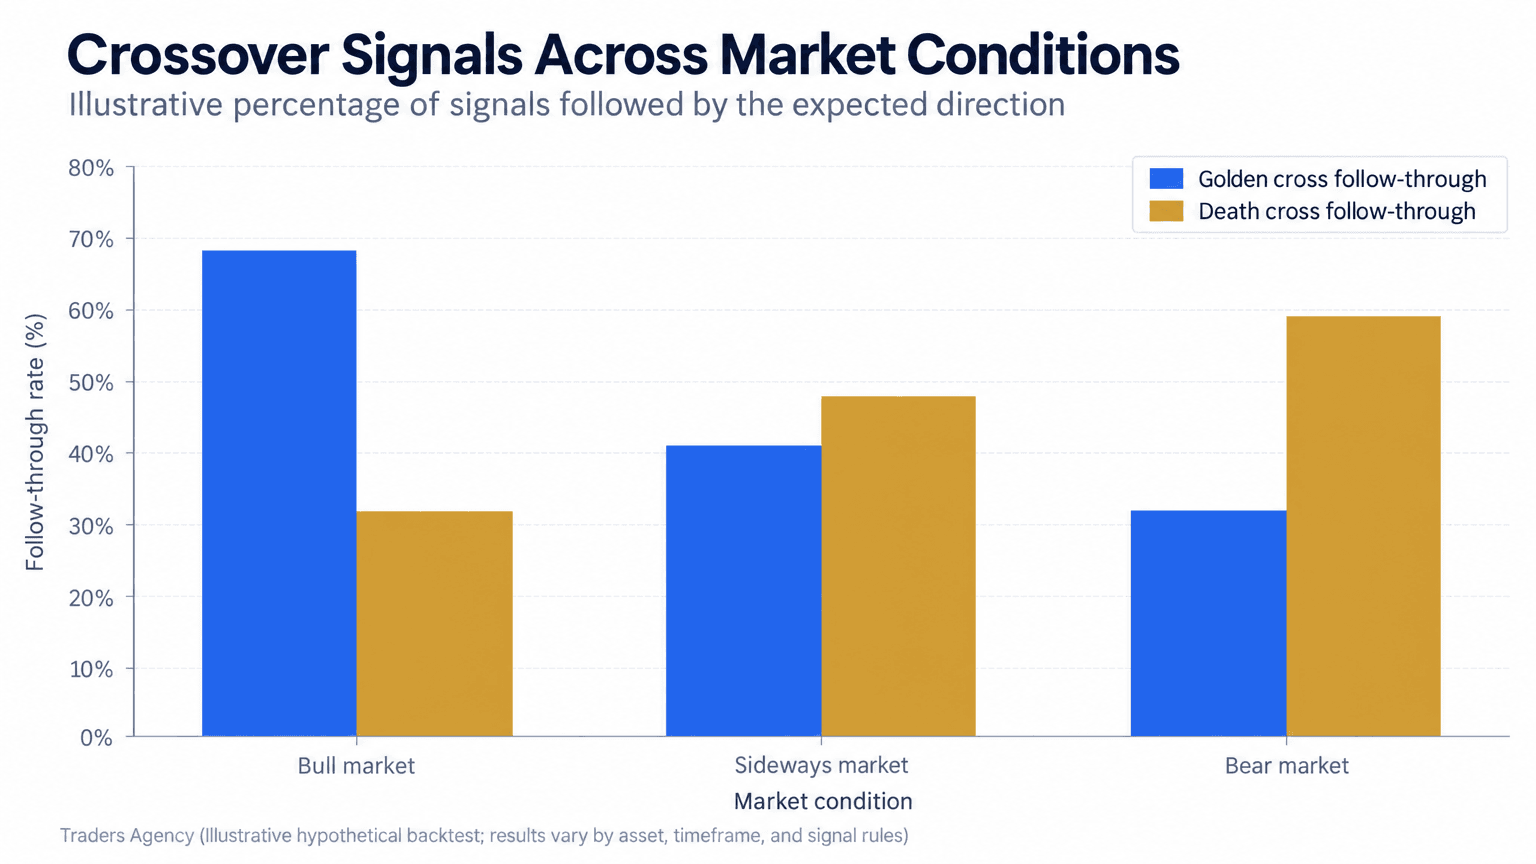
This is why we remind our members that the success rate of a golden cross is not a fixed number. It shifts depending on the asset, the timeframe, and the broader market backdrop at the time the signal fires.
How Do You Combine Golden Cross Signals with Other Indicators?
Relying on a crossover alone is one of the most common mistakes new traders make. We teach our members to treat a golden cross or death cross as a starting point for further confirmation, not a standalone trade trigger.
Volume Confirmation
A golden cross that forms alongside rising trading volume carries more weight than one that forms on thin, quiet trading. Higher volume suggests real participation behind the move rather than a low-conviction drift across the crossover line.
Momentum Indicators
Pairing a crossover with the Relative Strength Index (RSI) or MACD can help filter out weak signals. If a golden cross forms while RSI is also climbing out of oversold territory, that alignment adds confidence. If RSI is already extremely overbought when the golden cross prints, the move may be more exhausted than fresh.
Support and Resistance Context
Check whether the crossover is happening near a known support or resistance level. A death cross that forms right at a major support zone may run into more buying pressure on further downside than one forming in open air with no nearby support.
Is a Death Cross Always Bearish?
No, a death cross is not always bearish in practice, even though it's technically a bearish signal by definition. Because the signal lags price, it sometimes appears near the end of a decline rather than the beginning, occasionally marking a point closer to a bottom than a fresh breakdown.
This is a nuance that trips up a lot of newer traders. A death cross headline often shows up in financial media right as a decline is maturing, not necessarily right as a new leg down begins. Some historical cases have shown price stabilizing or reversing shortly after a death cross confirms, precisely because the worst of the selling had already occurred by the time the 50-day average caught down to the 200-day average.
That doesn't mean you should assume every death cross is secretly bullish. It means the signal needs context: where is price relative to recent support, what does volume look like, and has the broader trend actually shown signs of stabilizing.
When Should You Use This Strategy, and When Should You Avoid It?
Moving average crossovers work best for swing traders and position traders who hold positions over weeks or months, not for day traders looking for quick intraday moves. They're also more useful on liquid, widely traded stocks and major indices than on thinly traded small caps where price can gap erratically.
When Crossovers Work Well
- Markets with a clearly established directional trend already underway.
- Liquid large-cap stocks, ETFs, and major indices with consistent trading volume.
- Combined with confirmation from volume or momentum indicators.
- Used on daily or weekly charts rather than very short intraday timeframes.
When to Avoid Relying on Crossovers
- Sideways, range-bound markets where price repeatedly chops around the averages.
- Thinly traded stocks where sudden gaps can distort the moving averages.
- As the sole basis for a trade, with no stop loss or additional confirmation.
- On very short timeframes where the signal generates excessive false triggers.
Risk Management Basics
We never treat a golden cross or death cross as a reason to risk more than normal on a single position. Our approach includes:
- Setting a stop loss below a recent swing low (for long trades off a golden cross) or above a recent swing high (for short or hedge trades off a death cross).
- Sizing positions so that a single losing trade based on a crossover signal risks only a small percentage of total account capital, commonly 1% to 2%.
- Treating the crossover as confirmation alongside price action, not as an isolated green light.
Key Concept: Moving average crossovers are classified in standard technical analysis references as lagging trend indicators. They're built for confirming direction, not for pinpointing exact entries or exits. For broader market education, the Cboe site also publishes general resources on technical analysis.
Want expert trading insights delivered daily?
Join thousands of traders who rely on Traders Agency for market analysis and trade ideas.
Join Traders AgencyDISCLAIMER: Traders Agency does not offer financial advice. The information provided is for educational purposes only and should not be considered financial advice. Traders Agency is not responsible for any financial losses or consequences resulting from the use of the information provided. Trading carries inherent risks and may not be suitable for all individuals. You are advised to conduct your own research and seek personalized advice before making any investment decisions, recognizing the potential risks and rewards involved.
See more from Traders Agency on Google
Make us a preferred source and our market analysis will appear more prominently in your Google Search, Top Stories, and AI results.
Add to Preferred Sources