
Naked short selling is the practice of selling shares short without first borrowing or confirming the ability to borrow the underlying stock, which can produce a failure to deliver (FTD) when settlement comes due. Under current T+1 settlement rules in the US, a seller has one business day to deliver shares to the buyer. When that delivery does not happen, the trade becomes an FTD, and if the pattern persists, the security can land on the SEC Reg SHO threshold list.
We built this guide for traders who already understand how shorting works and want the actual mechanics behind one of the more misunderstood corners of market structure. We'll walk through how FTDs happen, how to read the data the SEC publishes, and how squeeze setups tied to FTD anomalies get built and (just as often) get destroyed.
By the end, you'll know how to pull Reg SHO threshold data, interpret an FTD spike against price action without jumping to conclusions, and size a speculative squeeze position in a way that won't damage your account if the thesis turns out to be wrong.
What Is Naked Short Selling and How Does It Differ From Covered Shorting?
Bottom Line: FTD spikes and Reg SHO threshold list data can flag mechanical stress in a stock, but they can't confirm a squeeze will happen or that timing will be right. Traders who act on this data should size positions as small, bounded speculation, since the whole position is the real risk, not just the stop distance.
Covered short selling means you locate and borrow shares before you sell them short, so delivery happens on schedule. Naked short selling skips that step, selling shares that haven't been borrowed or confirmed as borrowable, which creates settlement risk the moment the trade executes.
In a standard covered short, your broker's securities lending desk locates real shares, often from another institution's margin account or a custodian, and those shares move to the buyer by settlement. The short seller still owes the shares back eventually, but the transaction is backed by an actual security the entire way through.
A naked short skips the locate step entirely. The seller executes the sale, the stock changes hands economically, but no physical or electronic share actually arrives in the buyer's account on time. This is where standard short selling diverges sharply from naked short selling: one is a borrowing transaction with a sale attached, the other is a sale with the borrowing step deferred or skipped.
We want to be precise here, because retail trading forums often use "naked short selling" as a catch-all accusation anytime a heavily shorted stock doesn't behave the way longs expect. In reality, a huge amount of short selling activity, including aggressive strategies used by hedge funds, is fully covered and settles without issue. Naked shorting is a specific, measurable phenomenon with a data trail, not a feeling.
Key Concept: An FTD is a settlement event, not a verdict. It tells you shares did not arrive on time. It does not tell you why, and it does not prove intent.
Key Differences at a Glance
| Factor | Covered Short | Naked Short |
|---|---|---|
| Locate requirement | Locate confirmed before the sale | No confirmed locate |
| Settlement risk | Settles on T+1 as scheduled | Can generate an FTD |
| Legal status | Legal in virtually every market that permits shorting | Restricted or illegal in most developed markets, with narrow market-maker exceptions |
| Data visibility | Exchange short-interest reports | Indirect, through SEC-published FTD data |
How Do Failures to Deliver Occur Under T+1 Settlement?
An FTD occurs when a seller doesn't deliver shares to the buyer by the settlement date, which under T+1 is one business day after the trade date. FTDs can result from naked shorting, but they can also come from clerical errors, failed borrows, or settlement delays with no intent to manipulate anything.
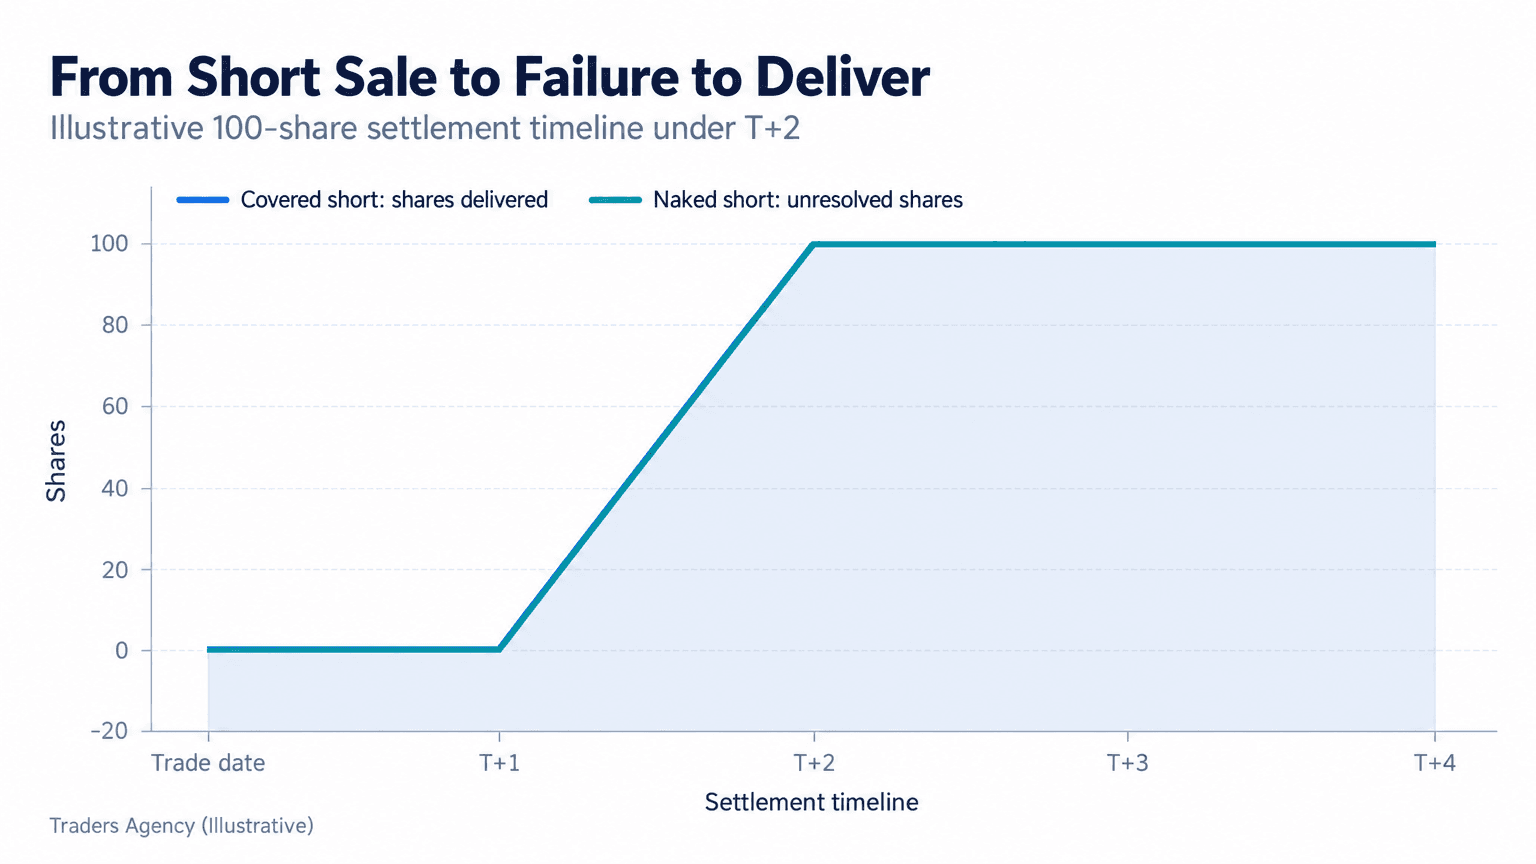
Here's the mechanical sequence. A trader sells 100 shares short on a Monday. Under T+1, settlement is due Tuesday. If the broker's lending desk already located shares, those shares get delivered and the trade is clean. If no shares were located, or the locate falls through between trade date and settlement date, Tuesday arrives with nothing to deliver. That open obligation is recorded as an FTD.
The clearing system, handled primarily through the Depository Trust & Clearing Corporation (DTCC), doesn't let that obligation quietly disappear. It persists until it's resolved, either through a late delivery, a buy-in, or continued failure that accumulates day over day.
Why FTDs Don't Always Mean Fraud
A single FTD on a given day is not proof of naked short selling. Market makers receive an exemption under Reg SHO for bona fide market-making activity, meaning they can sometimes sell short without a pre-trade locate because their function requires providing liquidity on both sides of the market.
Large, liquid names rarely show meaningful FTD totals because borrow supply is deep. It's the thinly traded, heavily shorted, high-retail-interest names where FTDs become a more interesting signal, precisely because borrow supply is already strained.
How Do You Read the SEC Reg SHO Threshold List?
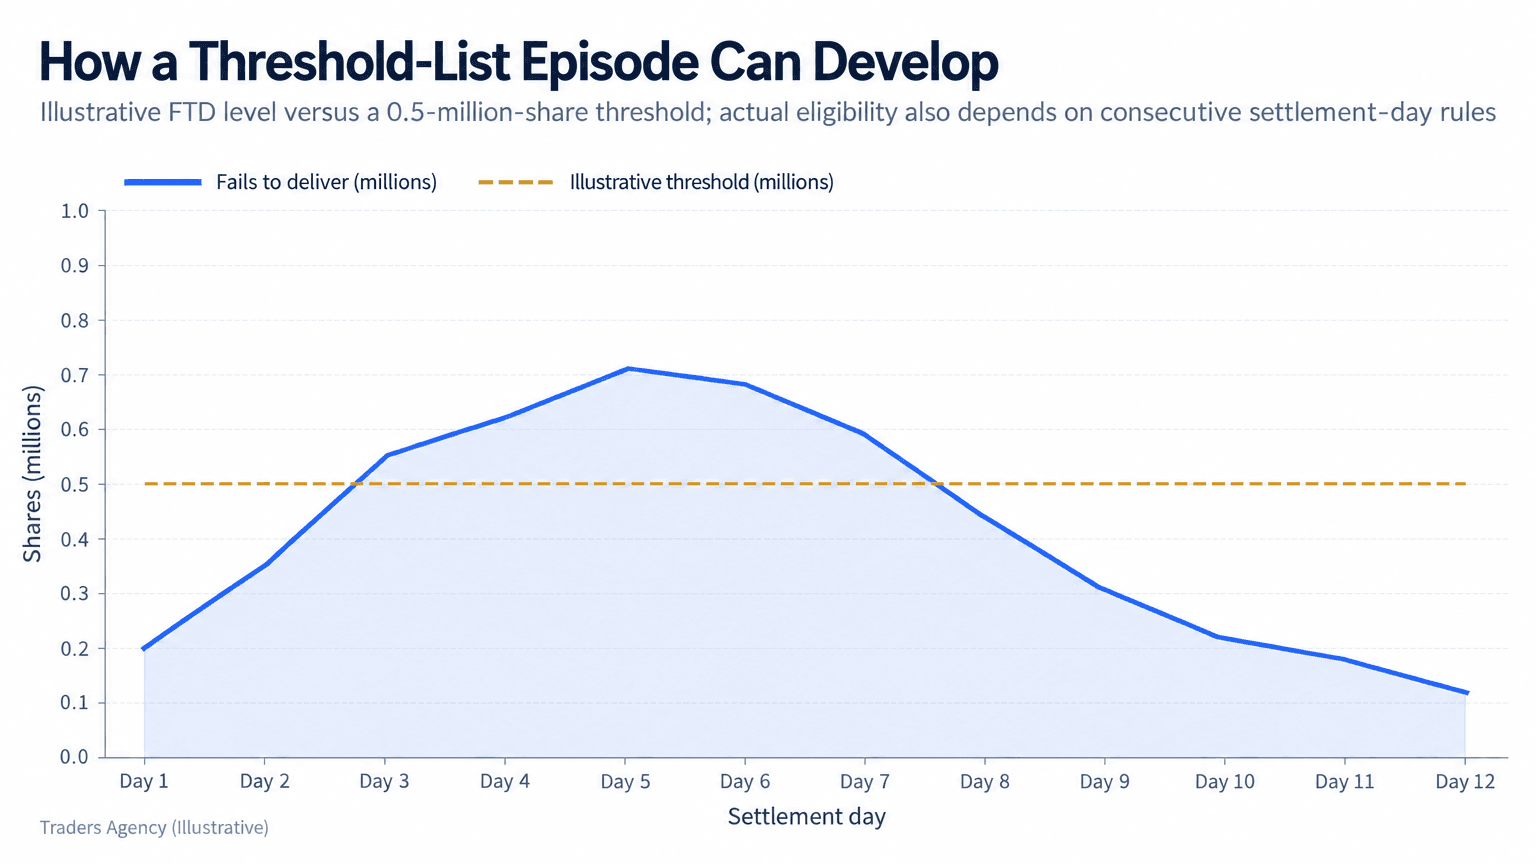
The SEC Reg SHO threshold list identifies securities where FTDs have reached a meaningful level across multiple consecutive settlement days, signaling potential settlement stress. A security qualifies when aggregate FTDs reach 10,000 shares or more and represent at least 0.5% of total shares outstanding, sustained for five consecutive settlement days.
| Threshold Parameter | Qualifying Level |
|---|---|
| Aggregate failures to deliver | 10,000 shares or more |
| Percentage of shares outstanding | At least 0.5% |
| Duration to qualify | 5 consecutive settlement days |
| Mandatory close-out trigger | 13 consecutive settlement days |
Self-regulatory organizations, meaning the exchanges and FINRA, compile this list daily from clearing data and publish it publicly. This is a genuinely useful dataset, because it's one of the few places where settlement-level friction becomes visible to retail traders instead of staying buried in clearinghouse back offices. The SEC also publishes raw fails-to-deliver files on a recurring schedule.
Once a security qualifies for 13 consecutive settlement days, Reg SHO's mandatory close-out provisions apply. Broker-dealers responsible for the fails generally must close out the position by purchasing or borrowing securities of like kind and quantity. That close-out requirement is what theoretically forces resolution of the FTD, and it's also the mechanism retail traders point to when discussing potential squeeze dynamics.
Step-by-Step: How We Pull and Read the Data
- Step 1: Go to the source files – Pull the SEC's published fails-to-deliver files, released twice a month and covering settlement data in roughly two-week increments.
- Step 2: Cross-reference the ticker – Check the name against the daily threshold list published by each exchange and FINRA to confirm current qualification status.
- Step 3: Track the trend, not the snapshot – A single day of elevated FTDs tells you far less than a rising five-day or ten-day pattern.
- Step 4: Note the removal condition – A security comes off the threshold list once FTDs stay below the qualifying levels for five consecutive settlement days, which can happen gradually or abruptly after a close-out.
Removal from the list does not mean the underlying short position disappeared. It means the specific failed-delivery obligation got resolved, which is a much narrower claim than "the short sellers covered and left."
Want expert trading insights delivered daily?
Join thousands of traders who rely on Traders Agency for market analysis and trade ideas.
Join Traders AgencyWhy Do FTD Spikes Line Up With Price Action?
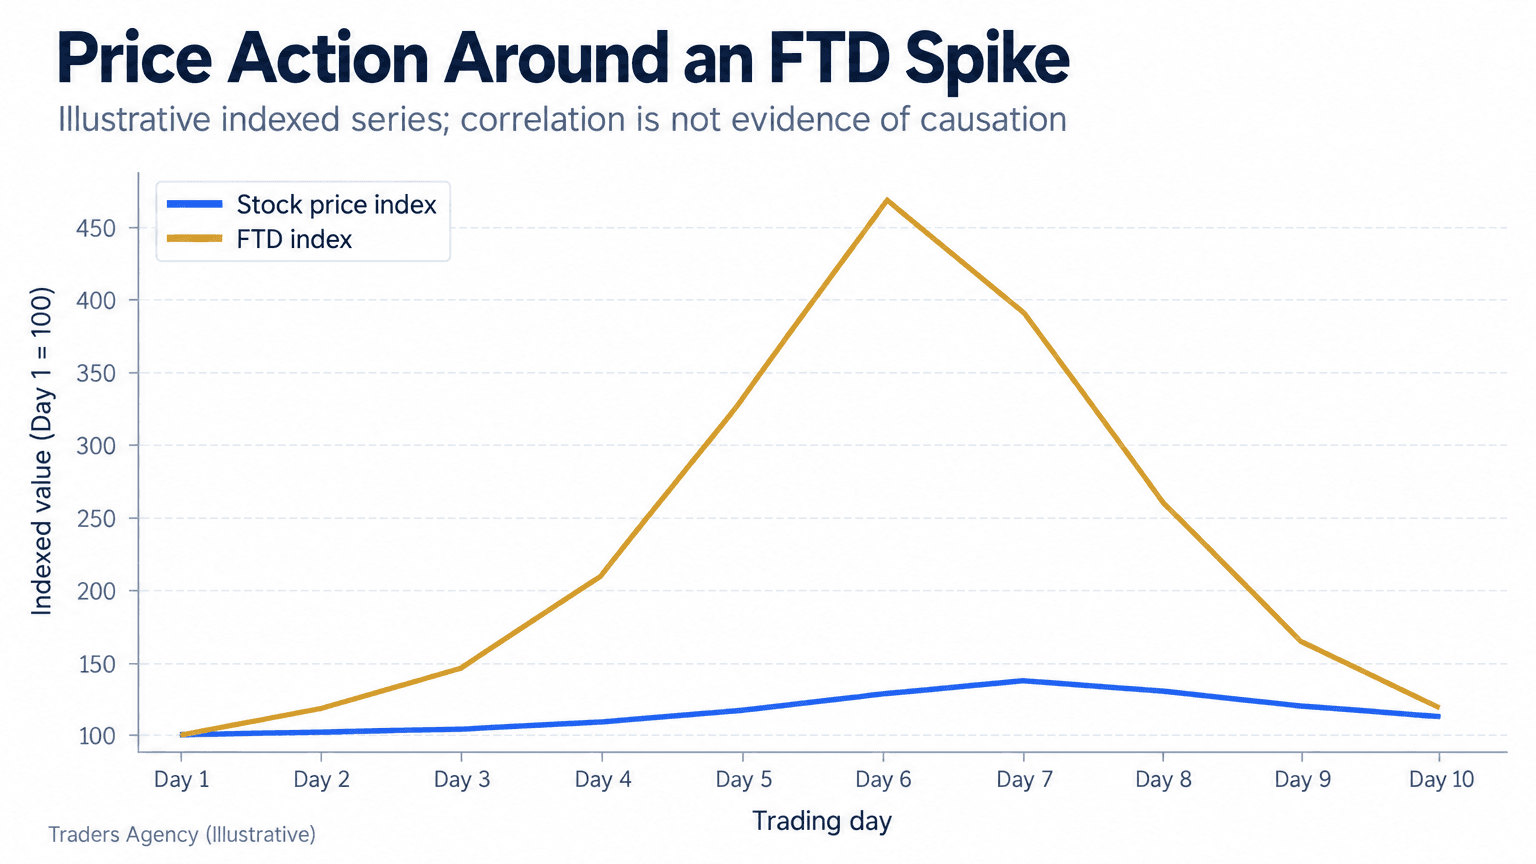
FTD spikes sometimes coincide with sharp price moves because both can stem from the same underlying condition: concentrated short interest meeting constrained share supply. That doesn't mean one causes the other, and treating correlation as proof of manipulation is one of the most common analytical mistakes we see in this space.
When a stock is heavily shorted and borrow becomes expensive or scarce, the mechanics that produce rising FTDs (failed locates, delayed borrows) are the same conditions that can produce a squeeze (shorts scrambling to cover into a thin market). The two phenomena travel together often enough that forum analysis treats them as cause and effect, when they're really two symptoms of the same problem: too many shorts, not enough available shares.
The Confirmation Checklist We Use
Before treating an FTD spike as a tradeable signal, we look for confluence across several independent data points, because no single data series holds up alone.
- Short interest as a percentage of float: elevated and ideally rising over recent reporting periods.
- Days to cover (short interest ratio): a high ratio suggests covering would take meaningful time given average volume.
- Cost to borrow: rapidly rising borrow fees indicate real scarcity, not just noise in the FTD file.
- Threshold list status and duration: how many consecutive settlement days the name has qualified.
- Options positioning: unusual call open interest near the current price can point to dealer hedging flows that amplify upside moves.
A spike in FTDs with none of the other confirming signals present is weak evidence of anything beyond settlement friction. A spike that lines up with rising borrow cost, high days-to-cover, and climbing call open interest is a far more interesting setup, though still nowhere close to a guaranteed outcome.
Naked Short Selling Rules by Market
Whether short selling is legal depends entirely on jurisdiction and on whether the short is covered or naked. In the United States, covered short selling is legal and regulated, while naked short selling is generally prohibited outside narrow market-maker exemptions under Reg SHO.
Is shorting illegal in the US? No. Covered short selling is a legal and common practice regulated by the SEC and FINRA. What's restricted is the naked variety, specifically selling without a reasonable belief that shares can be borrowed and delivered by settlement.
Looking at markets where short selling is banned or heavily restricted gives useful context. Some jurisdictions have imposed outright bans or temporary restrictions during periods of extreme volatility, usually citing financial stability concerns. Others permit short selling but apply stricter borrow and disclosure requirements than the US framework. The specifics shift over time, especially during crisis periods, so traders operating across multiple markets should check current rules in each jurisdiction rather than assuming US-style rules apply everywhere.
On the question of whether short selling is haram, this comes up frequently in discussions of Islamic finance principles. Some scholars view short selling as problematic because it can involve selling something you don't own (an issue tied to the concept of bay' al-ma'dum, or sale of a non-existent item) and because it may involve paying or receiving interest-like borrow fees. Other scholars have proposed Sharia-compliant alternatives to conventional shorting. This is a contested area within Islamic finance scholarship, and traders for whom it matters should consult a qualified Islamic finance scholar rather than general trading education content.
What Does History Show About FTD-Driven Price Moves?
Retail trading culture has produced several high-profile episodes where elevated short interest, constrained borrow, and FTD data all became part of the public narrative around a stock's price action. These episodes make useful case studies precisely because they show both the real mechanics and the tendency to overstate what the data proves.
In cases where a heavily shorted, small-float stock saw a rapid price advance, threshold list appearances and elevated FTD readings often showed up in the data around the same window. Retail communities frequently read this as direct evidence of an imminent forced short squeeze. In several of those situations, prices did produce sharp, short-lived advances. In others, elevated FTDs resolved through ordinary close-out mechanics without triggering anything resembling a squeeze, and prices simply drifted back down as speculative interest faded.
Remember This: FTDs and threshold list status tell you something is mechanically unusual in the settlement process. They tell you nothing about the direction, magnitude, or timing of any resulting price move.
Treating a threshold list appearance as a standalone buy signal has burned plenty of traders who bought a narrative instead of a risk-managed setup.
When to Stay Away: Risk Rules for Advanced Traders
Squeeze setups tied to FTD anomalies sit among the most volatile, unpredictable trades available in public markets, and that volatility cuts both directions with equal force. We'll be direct: this is not a strategy category where disciplined analysis gets you anything close to a controlled outcome.
When This Setup Might Warrant Attention
- Threshold list qualification persisting beyond the initial five-day window, approaching or exceeding the 13-day close-out trigger.
- Borrow fees rising sharply alongside days-to-cover figures that suggest covering would take real time.
- Options chain activity showing unusual call buying that could create dealer hedging flows on further upside.
- Position sizing that reflects binary, gap-prone outcomes rather than typical swing-trade sizing.
When to Walk Away Entirely
- When the only evidence is social media chatter about "naked shorts" with no corroborating borrow-fee or days-to-cover data.
- When you can't verify current threshold list status directly from the exchange or FINRA source.
- When position sizing would require more than a small, clearly defined percentage of account equity to feel "worth it."
- When you don't have a predefined exit plan for both the squeeze-up and the failure-to-materialize scenarios.
Granular Position Sizing for Squeeze-Adjacent Trades
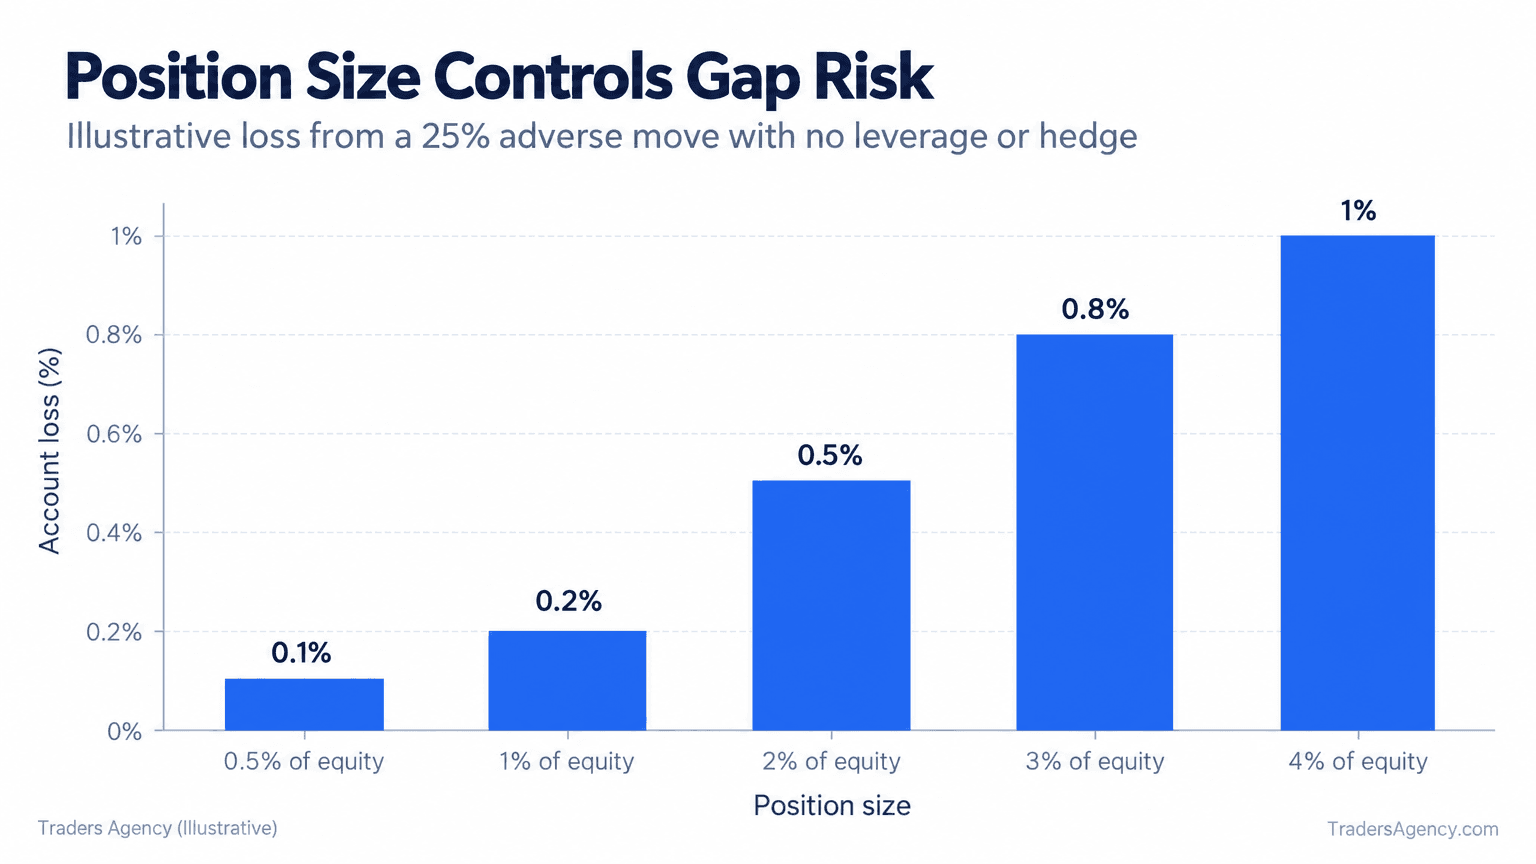
These setups carry serious gap risk, meaning a stop-loss order placed at a certain level does nothing for you if the stock gaps through it overnight or pre-market. A 25% adverse gap is not an exotic tail event in this category of stock. It happens with some regularity.
| Scenario | Position Size (% of Equity) | Adverse Gap | Account Impact |
|---|---|---|---|
| Disciplined sizing | 0.5% | 25% | 0.125% of equity (a bruise) |
| Oversized sizing | 4% | 25% | 1% of equity (eightfold more damage) |
The identical 25% gap produces an eightfold difference in damage, driven purely by position sizing and not by anything related to the quality of the thesis.
Watch Out: Stop-loss orders do not protect against overnight gaps. In FTD-driven squeeze names, treat every position as a small, clearly bounded bet where the full position size is the real risk, not the distance to your stop.
This is the core discipline we teach around FTD-driven setups. The data can tell you a stock is mechanically stressed, but it cannot tell you your stop will hold, your gap risk will stay contained, or your timing will be right. Size accordingly, and treat any individual squeeze-adjacent position as a small, bounded speculation rather than a core holding.
Want expert trading insights delivered daily?
Join thousands of traders who rely on Traders Agency for market analysis and trade ideas.
Join Traders AgencyDISCLAIMER: Traders Agency does not offer financial advice. The information provided is for educational purposes only and should not be considered financial advice. Traders Agency is not responsible for any financial losses or consequences resulting from the use of the information provided. Trading carries inherent risks and may not be suitable for all individuals. You are advised to conduct your own research and seek personalized advice before making any investment decisions, recognizing the potential risks and rewards involved.
See more from Traders Agency on Google
Make us a preferred source and our market analysis will appear more prominently in your Google Search, Top Stories, and AI results.
Add to Preferred Sources